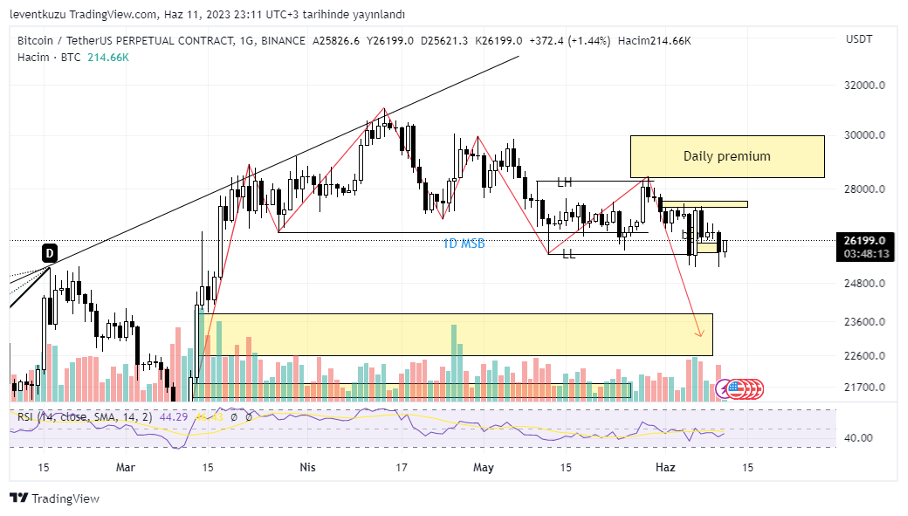
BTCUSDT
Daily analysis
The market structure remains bearish as the previous weeks. The price tested the daily premium zone just with a wick. LL level was slightly broken with a candle but it is not apparent on the daily chart. As we had sharp downward price movements this week, it is not easily detected on daily. Lower time frames can depict better short term movements. On the daily chart $22,500 is the place to be filled to ensure the closure of imbalance. Also, discrete liquidity heat maps show liquidation areas around $22,000 level.
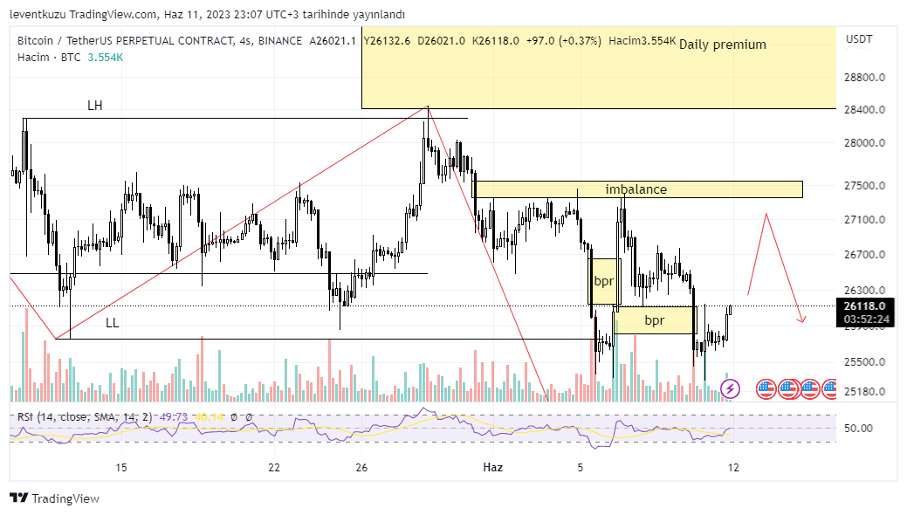
4H analysis
The price was between LH and LL levels from May 10th, which exhibited a price range. We now have a new LL with the last candle close lower than previous LL level. The occurred imbalance level was a good place for short positions. The price reached there twice. Two different bpr gaps were formed. Now imbalance layer is still a good target for possible short positions.
XAUUSD
Daily analysis
From the early May the price of the gold visited twice the weekly liquidity void. The price bounced from the top of the imbalance level. The market structure is still bearish on daily since no candle was closed over the LH level. In this case, 4H premium zone may be visited after reaching a lower price. On the other hand, the market structure will remain bullish as long as the price is above $1,800. Furthermore, MA100 remains a solid support line.

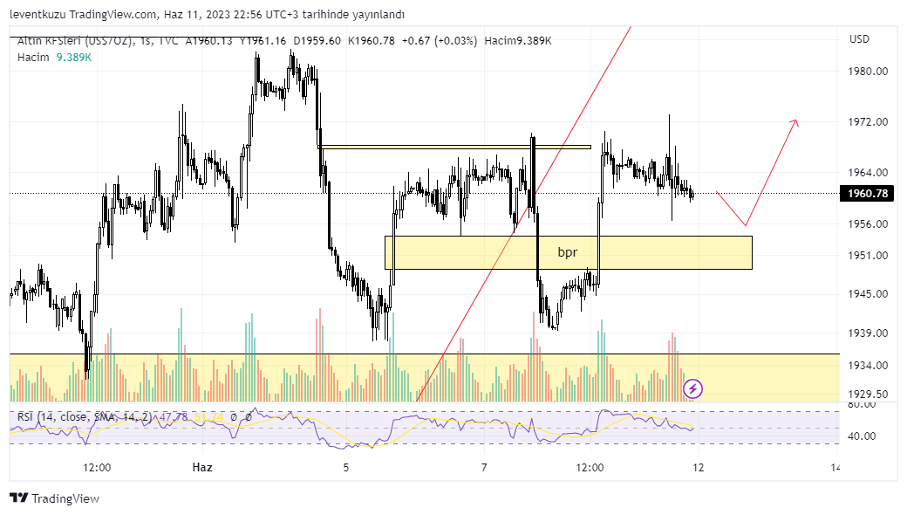
Hourly analysis
The most remarkable price movement on 1H time frame was bpr. After the first occurrence of bpr, we expected the rise but the candle still included imbalance itself. Therefore, the bpr remained with the third candle including imbalance. The current expectation is to fill the bpr level with shallow descending candles and then move the price upwards.
EURUSD
Daily analysis
Last week the price reached the imbalance level and this level held the price. Additionally the market structure of the daily chart is still bullish. The price is in a daily discount zone. In the previous assessment of EURUSD pair, we noted a harmonic pattern but its TP2 target has not been reached yet. According to daily structure, there is still some possibility that TP2 target can be reached due to the structure of the daily chart.

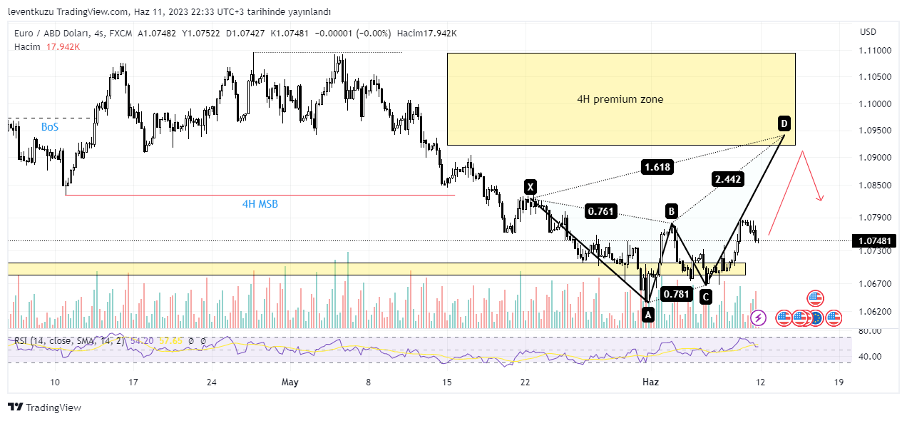
4H analysis
The EURUSD pair evaluated to be in bearish since the last three weeks. After the market structure break on 4H chart, the price did not reach 4H premium zone. If the early drawn bearish butterfly harmonic pattern occurs, the price could reach the premium zone. After that, retracement can occur until 0.618 of the harmonic pattern.
Hourly analysis
Last week market structure turn to bullish on 1H time frame. The price reached 1H discount zone and reacted from 1H bullish order block. This level reacted well several times, which shows the intention of the pair to be carried to further high levels.
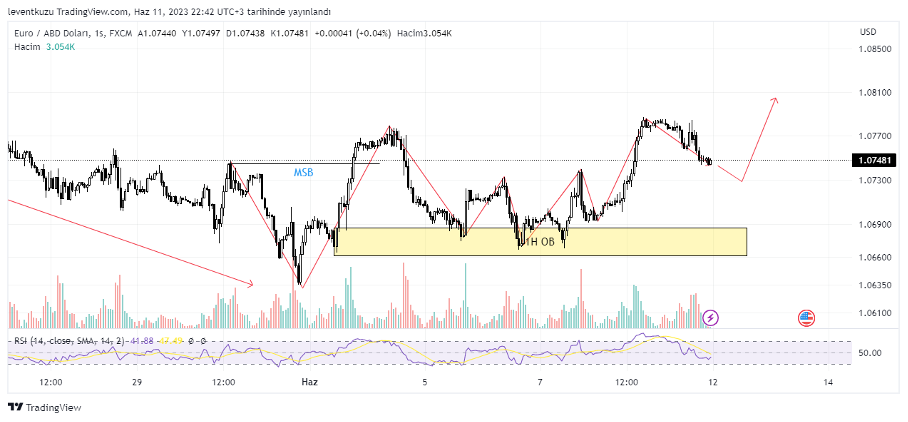
As a sum of all time frames, the probable price movement can be upwards until 1.095, then correction until 1.08s, and then upwards to 1.12 level.
** Important Note: Above ideas are not investment advice!**
Nihat Çetinkaya
https://twitter.com/nhtctnk
I’m a private trader of over 7 years, based in Istanbul.
All trading and research are my opinion, not investment advice.