BTCUSDT
Daily analysis
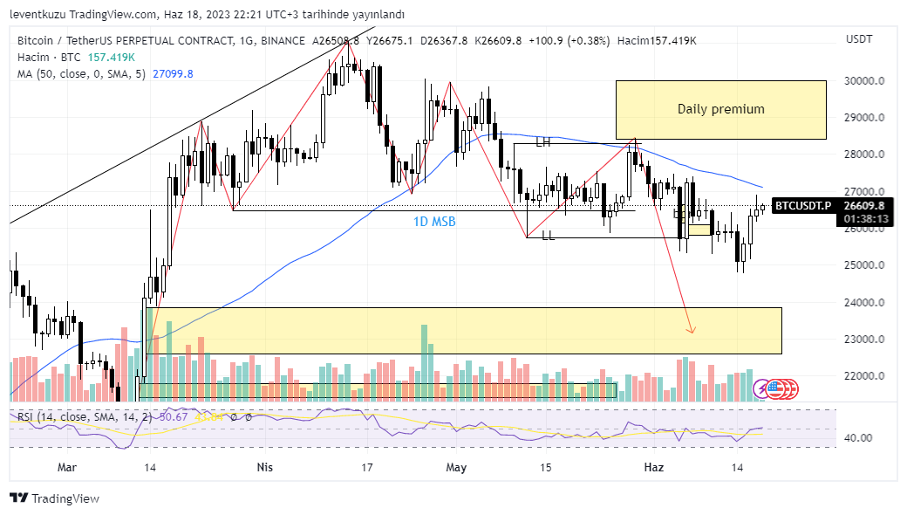
The market structure remains bearish as the previous weeks. The price tested the daily premium zone just with a wick. LL level was slightly broken with a candle but it is not apparent on the daily chart. As we had sharp downward price movements this week, it is not easily detected on daily. A positive shift was available over the last four days. However, this is not enough to make a MSB on the current time frame. Volume is not sufficient and the price is now close to MA50, which acted as both support and resistance on the last four weeks. $27,000 is a critical price for a possible reversal. $24,000 and $22,500 is still an important imbalance zone.
4H analysis
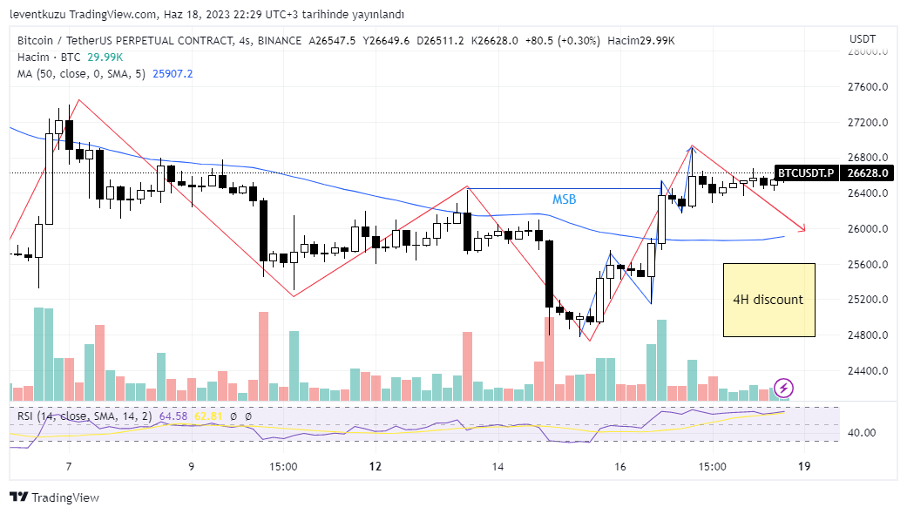
The price made a MSB on 4H. The leg that made the structure change formed from a regular Elliot wave, which had the highest movement on the 3rd leg. Possible price reversal can be $25,600-$26,000 price range which are the levels of MA50 and 4H discount zone, respectively. After that level, we can decide if the price wants to move upwards or it needs lower levels as in HTF.
XAUUSD
Daily analysis
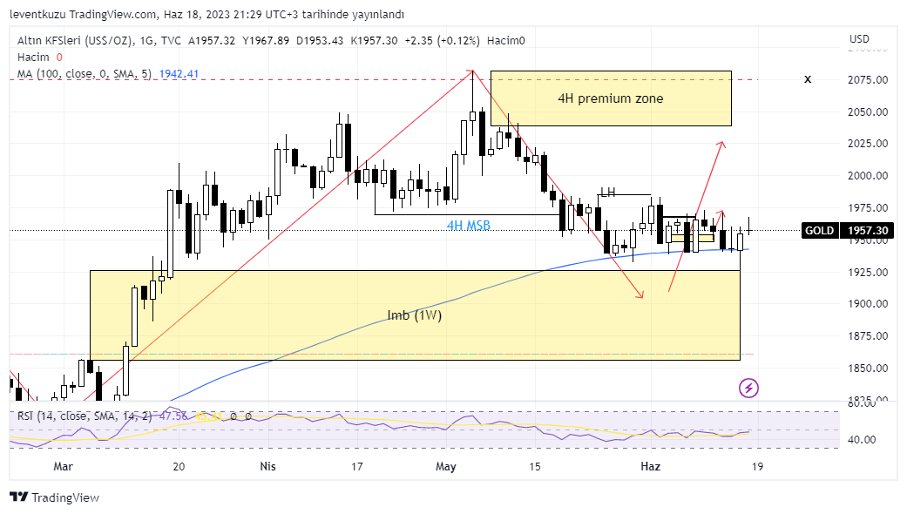
On the previous week, the price bounced from the top of the imbalance level and the area is now reduced. The market structure is still bearish on daily since no candle was closed over the LH level. In this case, 4H premium zone may be visited after reaching a lower price. On the other hand, the market structure will remain bullish as long as the price is above $1,800. It has been two weeks that MA100 exhibiting a strong support line. We could only observe some wicks under MA100. This level is another factor that shows us the probable price movement direction.
Hourly analysis
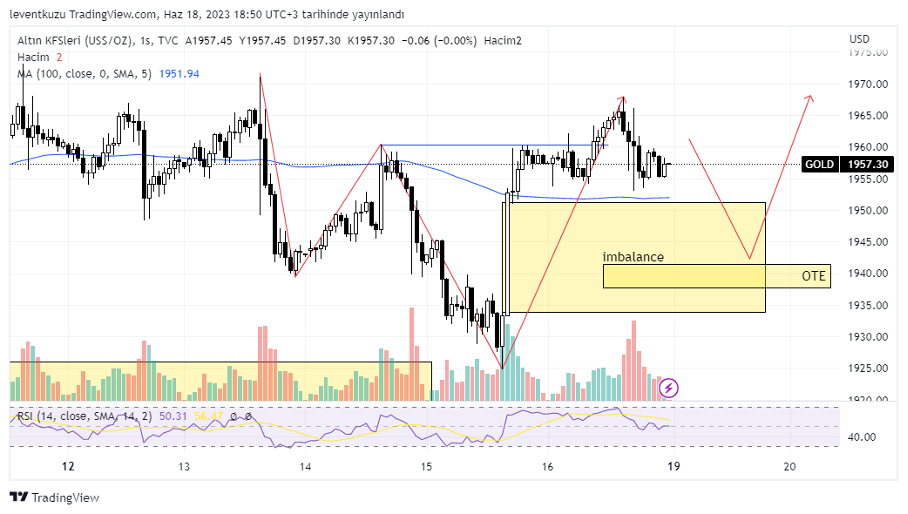
1H market structure was bearish on 1H. However, it shifted to bullish after closing candle over the blue horizontal line. Price left a severe imbalance zone and price held over MA100. The possible entry can be done from the optimal trade entry area which is between Fibonacci 0.618-0.705 levels of the last bullish price movement.
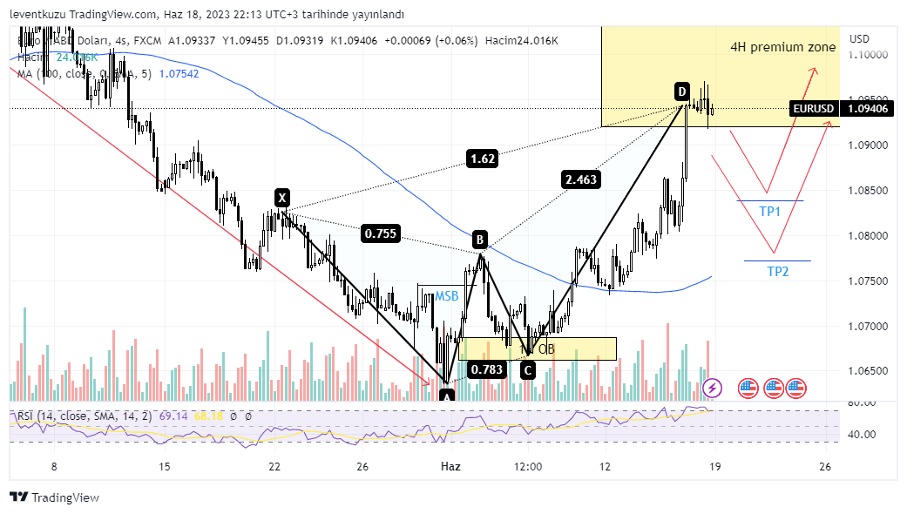
EURUSD
4H analysis
The bearish butterfly harmonic pattern which was drawn last week before its full occurrence reached its target now we have a possible price reversal from this level to TP-1 or TP-2. Current price is in the premium zone of 4H time frame. RSI also gives a signal of possible drop of pair price. TP-1 is also the same level for MA100 intersection on 1H time frame.
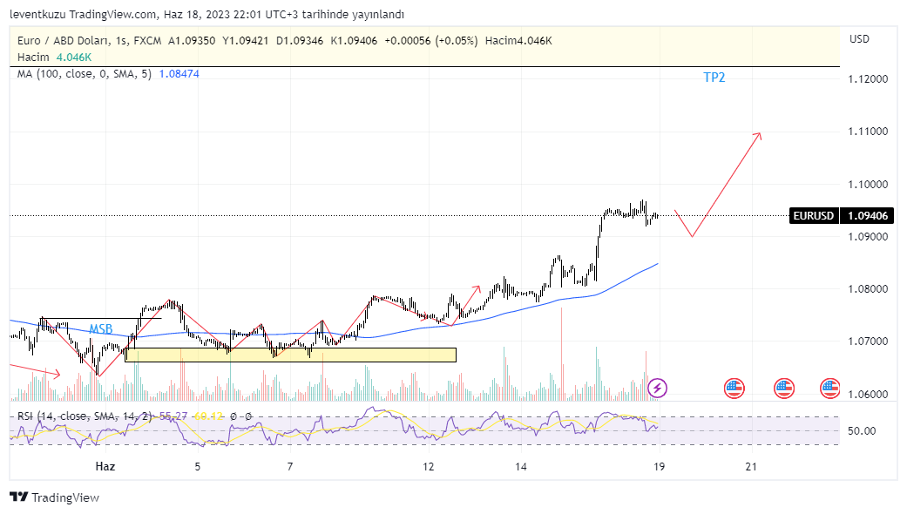
Hourly analysis
After shifting to bullish market structure, the price created a favourable order flow over MA100. This satisfied the expectation of the last week. This level reacted well several times, which shows the intention of the pair to be carried to further high levels. As price holds over MA100 curve, we may expect to react TP2 zone. However, RSI shows a reduction in possible bullish movement. The price may visit MA100 again and we may decide whether the trend will continue or shift the LTF trend to bearish. If the price reacts from MA100, then we may expect a price movement which is shown by red arrows.
** Important Note: Above ideas are not investment advice!**
Nihat Çetinkaya
https://twitter.com/nhtctnk
I’m a private trader of over 7 years, based in Istanbul.
All trading and research are my opinion, not investment advice.