BTCUSDT
Daily analysis
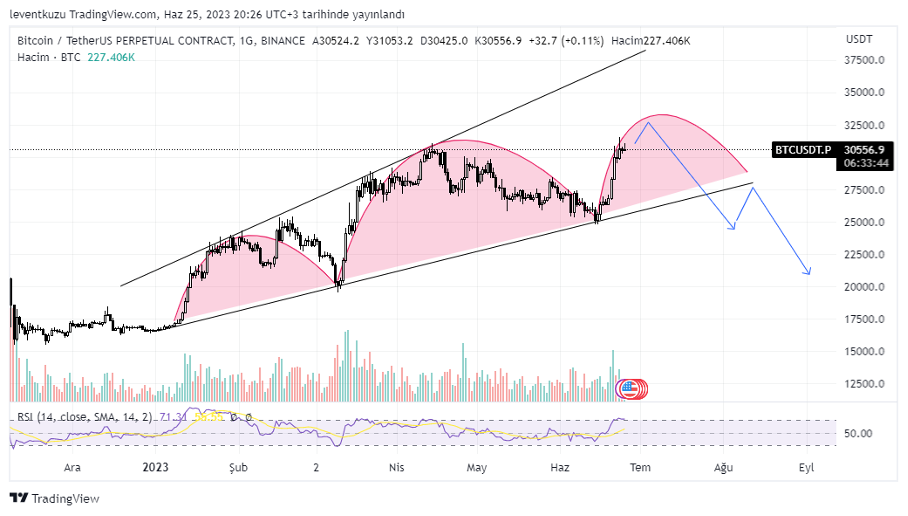
The chart for BTCUSDT shifted to bullish several times ago. The current chart exhibits two different bearish formations. First there is broadening wedge. Second, price flow occurs and it seems that there is a possibility for the third move. RSI is in the overbought zone. In the possibility that price cannot reach the upper boundary of the broadening wedge, shoulder-head-shoulder formation will occur.
4H analysis
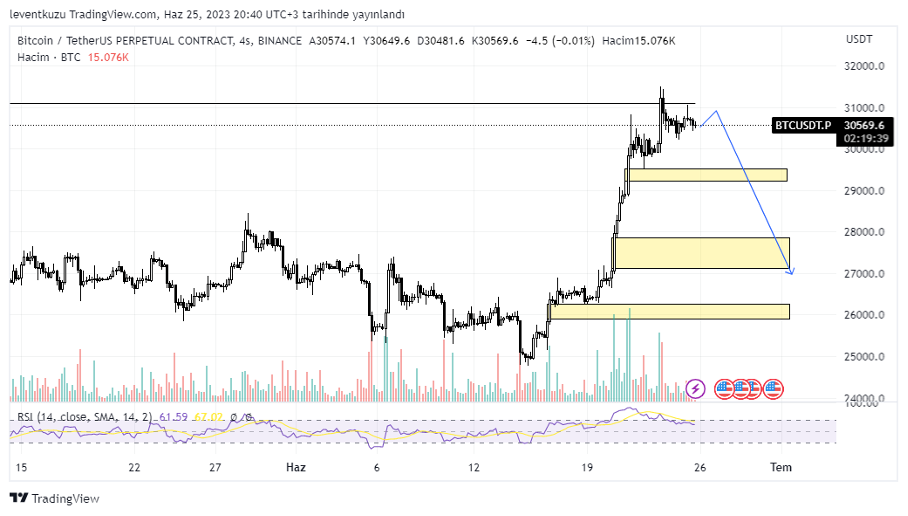
The price reached a previous swing high level. Candle closed over that level on 4H time frame but couldn’t hold that level. On the other hand, this is just a wick on daily chart, which means, liquidity was taken at that level. Several imbalances were formed below the current price that are shown on the chart as yellow boxes. Also the drop of RSI shows us a momentum decline. We may expect a price drop as shown on the chart.
XAUUSD
Weekly analysis
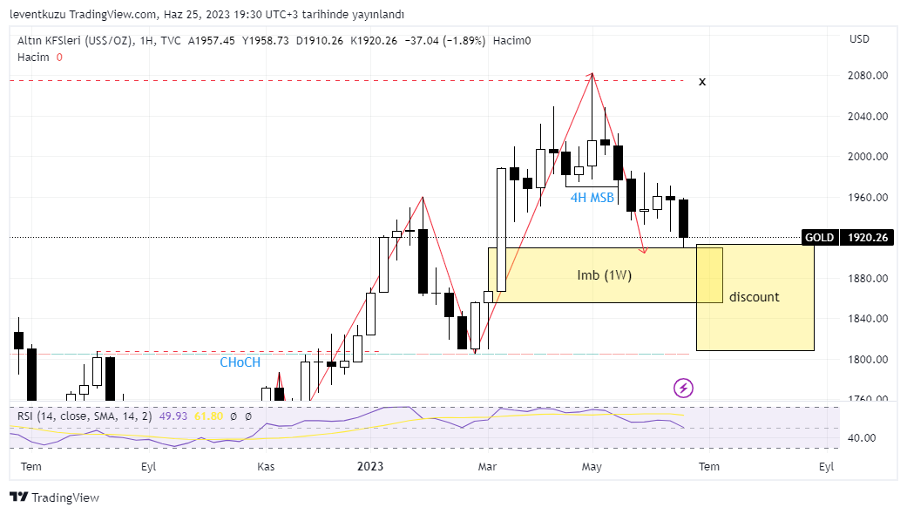
As of a weekly analysis, we have mentioned the importance of the weekly imbalance several times. RSI was giving the alert of an over-bought zone. That’s why we expected the price to move lower and close the imbalance full or partially. The price swept some part of the imbalance and we reduced the imbalance zone accordingly. On the other hand, price reached the discount zone of the impulsive movement.
Daily analysis
After the shift of market structure to bearish, EMA100 exhibited a strong resistance several times. All price reactions after the drop reacted from the same line. At first, price should close EMA100 and then make a MSB to convince us that it is a shift to bullish market structure. $1,970 is important to make this difference on 4H time frame. In the current state, all upward price movements can be considered as an opportunity for taking short positions.
EURUSD
4H analysis
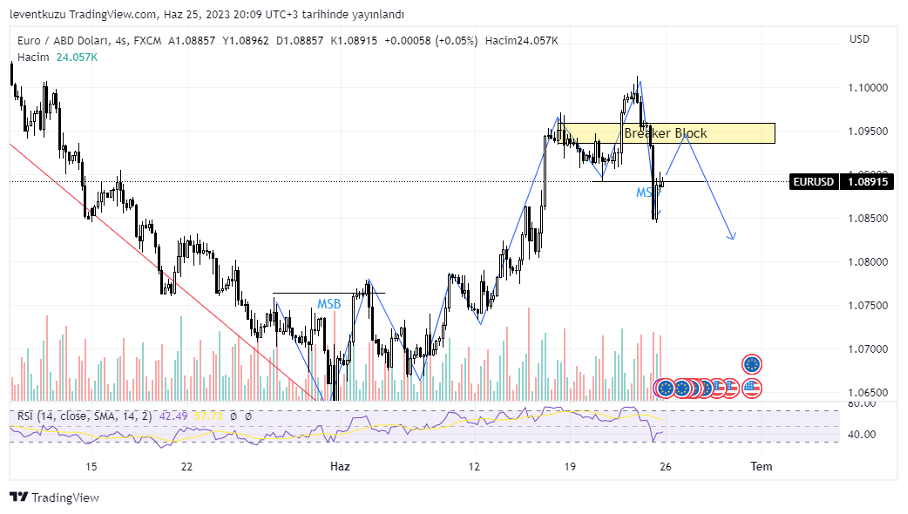
In the early June, EURUSD pair turned to bullish on 4H time frame. This week the price made a bearish market structure break. First, it filled a previous imbalance and now new imbalance occurred. Now, there is a possibility that price can close the new imbalance and generate a Quasimodo pattern. In this case, breaker block can be a zone for short entry.
** Important Note: Above ideas are not investment advice!**
Nihat Çetinkaya
https://twitter.com/nhtctnk
I’m a private trader of over 7 years, based in Istanbul.
All trading and research are my opinion, not investment advice.