BTCUSDT
1D analysis
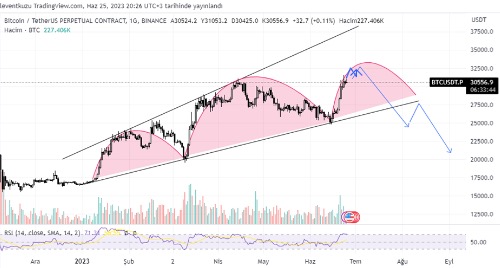
The possible price pattern was mentioned as either a broadening wedge or shoulder-head-shoulder formation last week. There were severe price movements last week. But when we observe it from daily chart, it is just a sideways price movement. These movements are shown by blue arrows in the current time frame. The expectation is still valid for the daily chart.
4H analysis
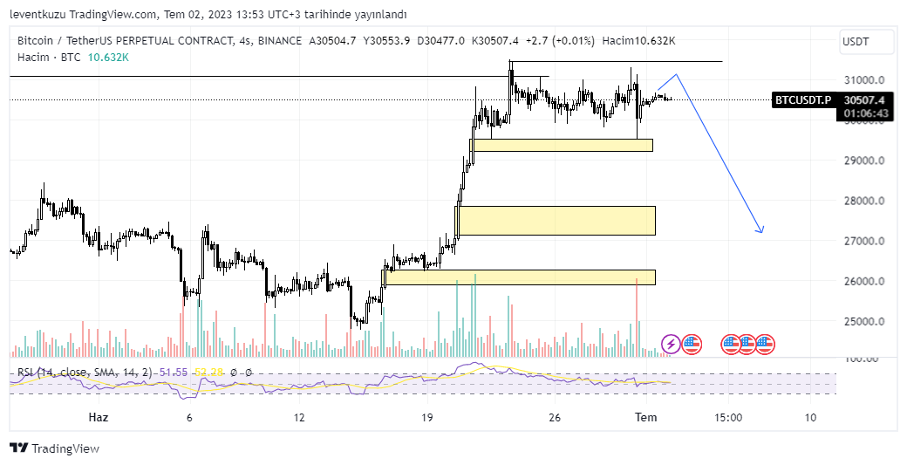
The price reached a previous swing high level last week and removed the SH liquidity. We can now observe a range for the last ten days. Last week the imbalance spans were provided as yellow boxes. They are still valid and left on the chart. The price dropped to the top of the closest imbalance level and reacted from there. The momentum decline is also another supporting indicator that the price can move to lower levels. The expectation is still valid and the movement can be to lower values as shown on the chart.
XAUUSD
Daily analysis
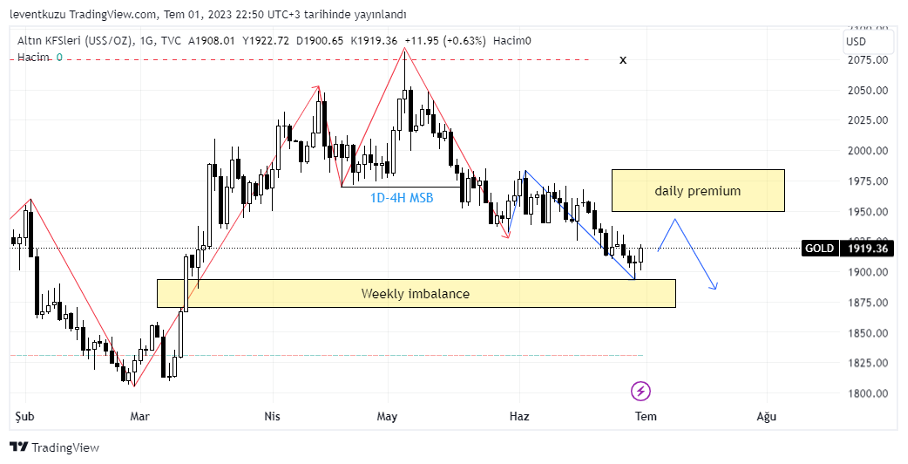
In our previous analysis, we had mentioned the importance of the weekly imbalance level shown on the daily chart. In this week’s chart we can clearly observe that most of the imbalance is repaired. Now price seems to start a retracement movement currently. When the price reaches to the premium zone, we must watch the momentum of the price to decide if it is going to make a market structure break or not. Then we can think whether this is a retracement or not. LTF charts below show a bullish MSB. In any case price will somehow increase according to our predictions. However, continuation is a next issue to be cleared.
4H analysis
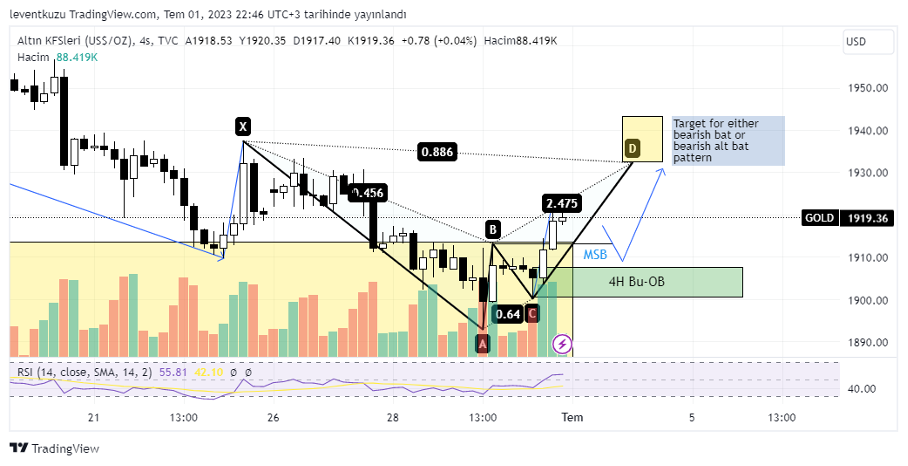
Market structure of gold was bearish for several times. EMA100 was exhibiting a strong resistance. After entering HFT discount zone, price made a MSB in this time frame. Now it seems that there is a possible bearish bat harmonic pattern formation. But it can also extend to bearish alt bat. In the case that one of these patterns occurs, then we may expect the price to reach $1,932-$1,943.
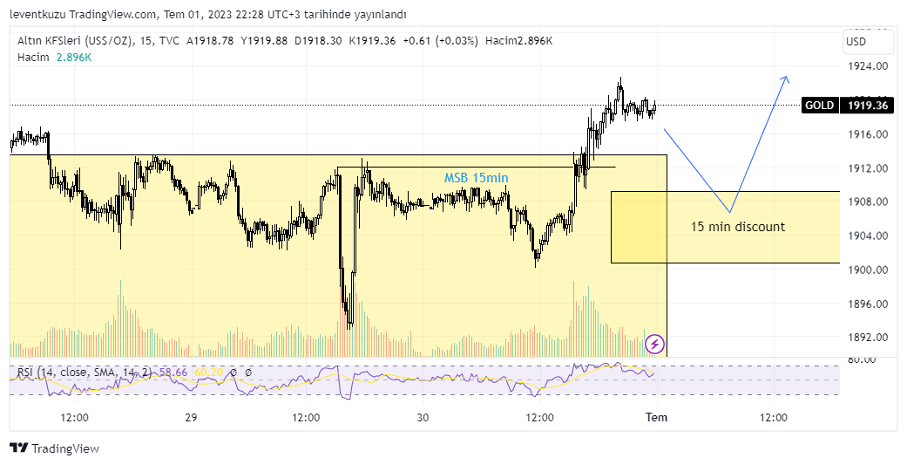
15 min analysis
As of short term analysis for a probable entry, $1,900-$1,909 price span is the discount zone for the 15 min wave which resulted in a market structure break in 15 min. This price gap is in line with 4H bullish order block, which is between $1,900-$1,907.
EURUSD
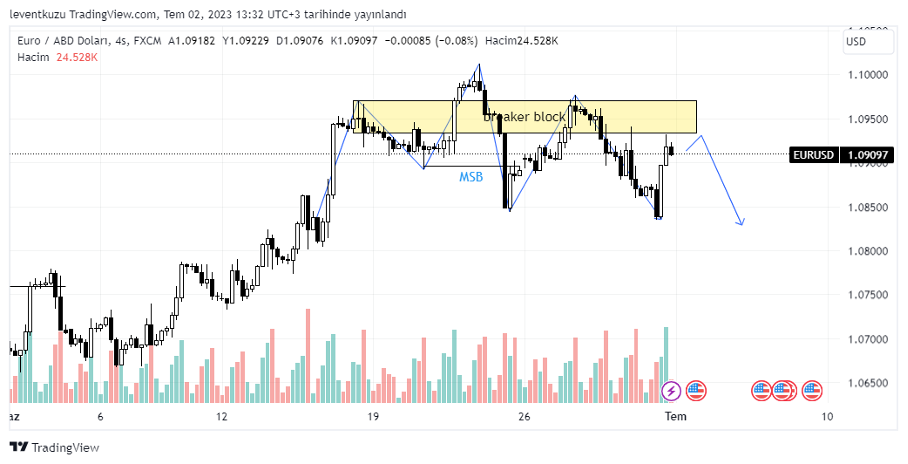
4H analysis
Last week, we had an analysis for 4H time frame as HTF. Because there was a clear sign for a possible entry. In order to not confuse, we did not share any higher time frame entries or comments. The possible Quasimodo pattern realized with a perfect entry. Now the price visited back the breaker block. The pair also made BoS with a small amount. That’s why it is not shown on the chart. The pair value still has tendency to visit lower prices.
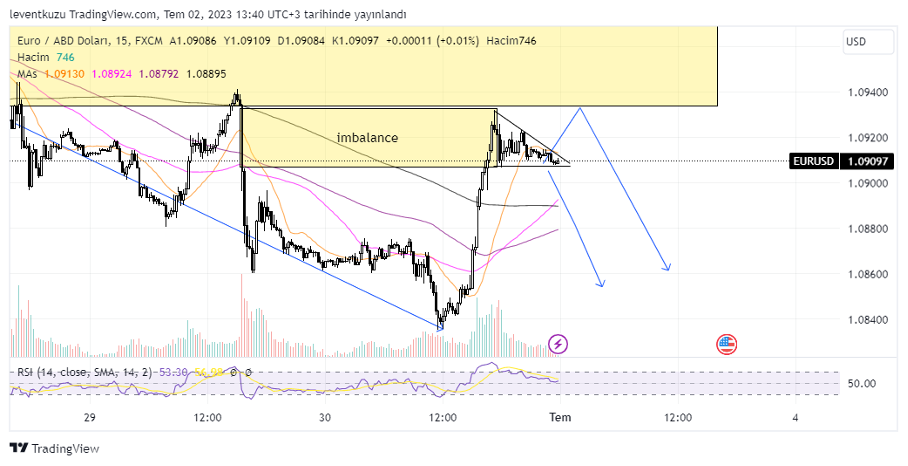
15 min analysis
The price closed an imbalance gap in LTF. According to RSI, the price is losing momentum. On the other hand, a descending triangle is formed. The two possible price patterns are shown as blue arrows. It can either break the triangle from upper side and move to lower prices or it can directly move to lower prices.
** Important Note: Above ideas are not investment advice!**
Nihat Çetinkaya
https://twitter.com/nhtctnk
I’m a private trader of over 7 years, based in Istanbul.
All trading and research are my opinion, not investment advice.