BTCUSDT
Weekly analysis
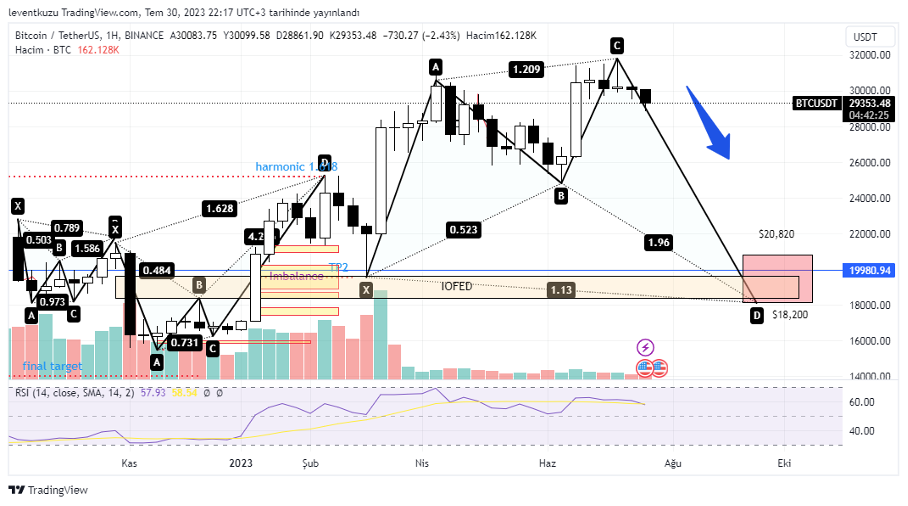
Over the last one year several harmonic patterns were formed on weekly BTCUSDT chart. Now, there is a potential bullish shark pattern on the pair. But to be honest this is just an imagination for now. Harmonic patterns are to be used after the reach of the price to the D point. D point can be between fib 0.886 and 1.13 of X-A leg. The area is shown by a red rectangle. On the other hand here is an IOFED zone between $19,550 and $18,400s. For me, that area is the extreme lowest price of BTC that can be reached. It is also obvious that there is low trading volume in the market since late March.
4H analysis
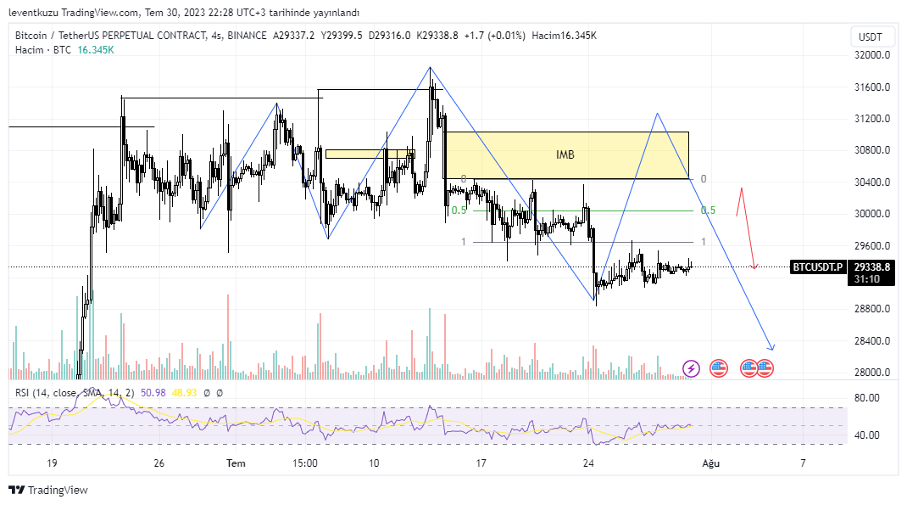
The trading range was broken down at the beginning of the week. The price tried to gain the range again once. But it was not possible to gain it again. Price $30,400s is still an important zone to start a downward movement. On the other hand, there is a potential Quasimodo pattern, which is shown by blue colour. If the price reaches $31,200s, then we may expect $28,000s in mid-term.
XAUUSD
Daily analysis
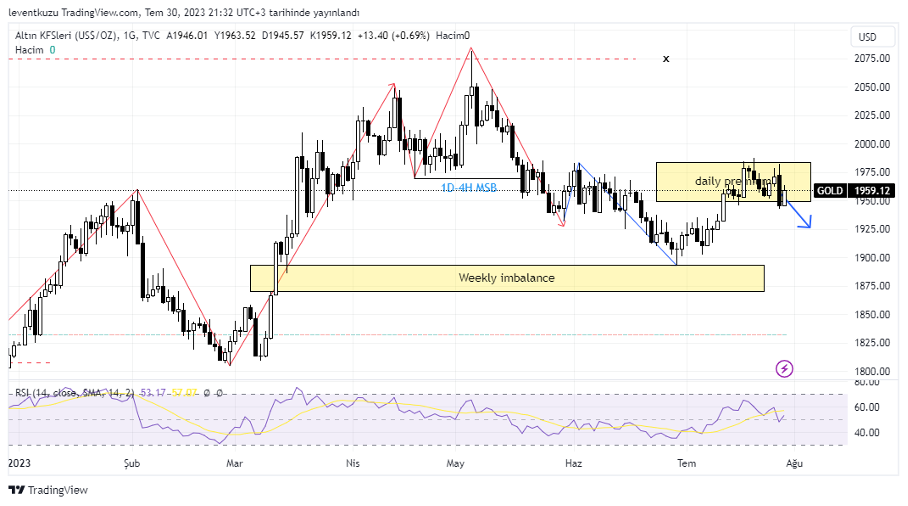
The price was within the daily premium zone last week and our expectation was a bearish movement since the price could not break the last lower high peak. The price of gold dropped sharply by a strong bearish candle. The candle left FVG on LTF. The price took liquidity of the pair at the top of the daily premium zone. Potentially stop losses of traders who shorted at previous LH were triggered.
4H analysis
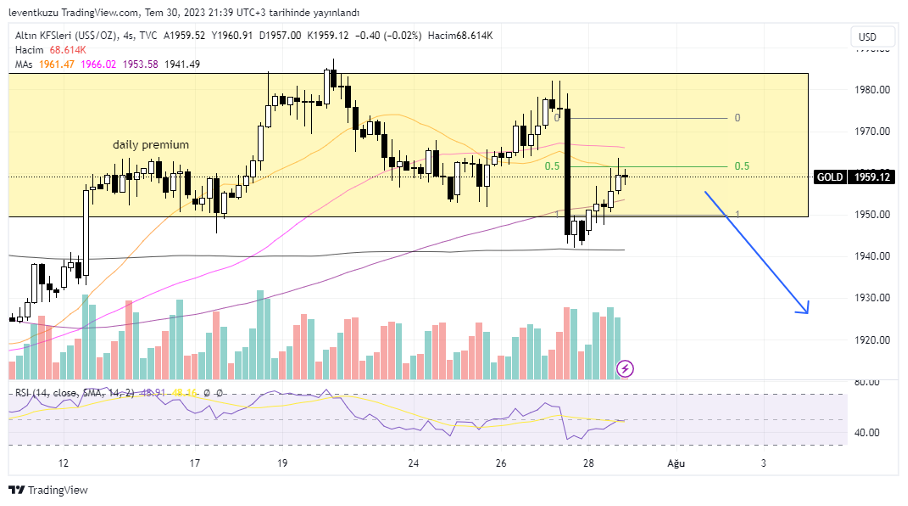
MA200 on 4H time frame exhibited a strong support and the price movement with a significant FVG couldn’t pass through that level. Usually, fib 0.5 level of a FVG is an important point for the price to make a potential reversal price movement. Now, the price is within MA200-20 levels and reached fib 0.5 region. The expectation is to make a lower low from the current price.
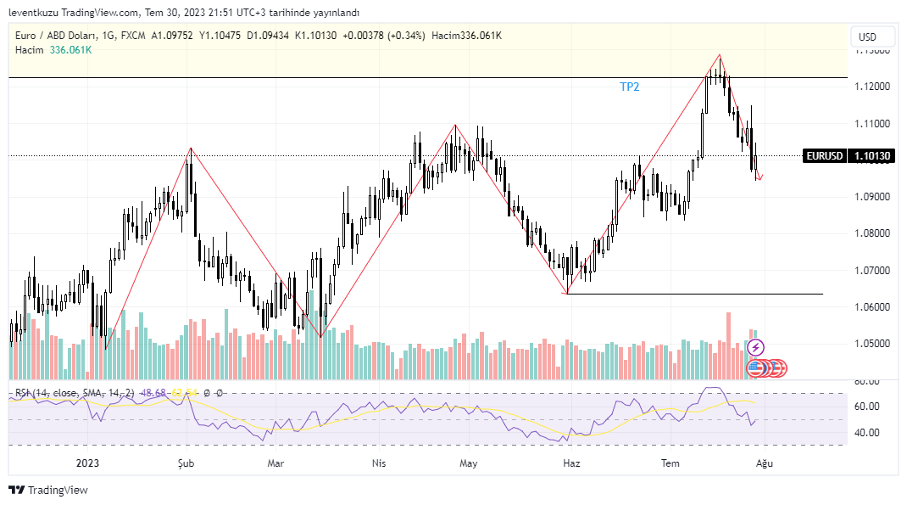
EURUSD
1D analysis
The market structure is still bullish on daily chart. However, the price reached an important zone. The zone is TP2 level of the harmonic pattern on weekly chart and a premium zone. The pair should go down below 1.0635 and close candle to consider a change of character in the market. EURUSD is considered bullish on daily unless there is a candle close below the horizontal black line.
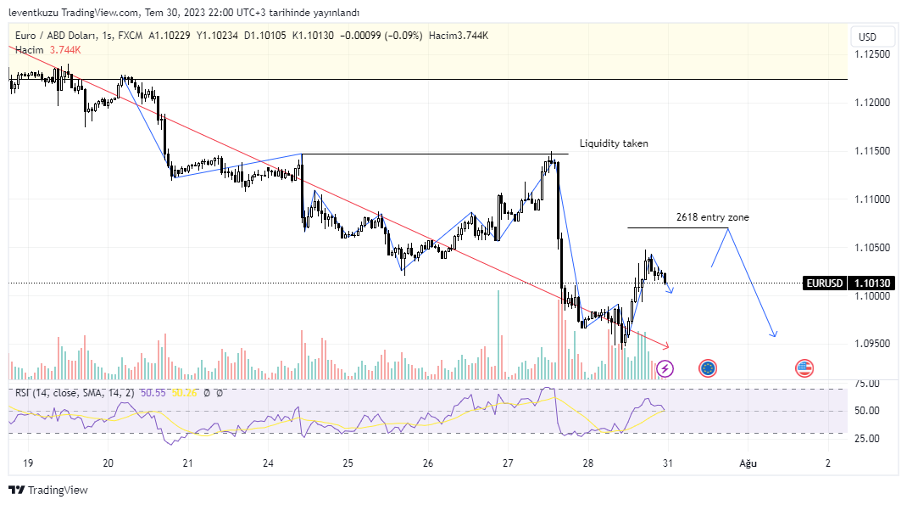
1H analysis
The market structure of EURUSD is bearish on 1H time frame. There was a reversal price movement between 26 and 28th of July. The movement took the liquidity and price continued to down downwards with strong acceleration. 1.107 price of the pair is a potential 2618 zone, which is fib 0.618 level between the liquidity zone and the last swing low.
** Important Note: Above ideas are not investment advice!**
Nihat Çetinkaya
https://twitter.com/nhtctnk
I’m a private trader of over 7 years, based in Istanbul.
All trading and research are my opinion, not investment advice.