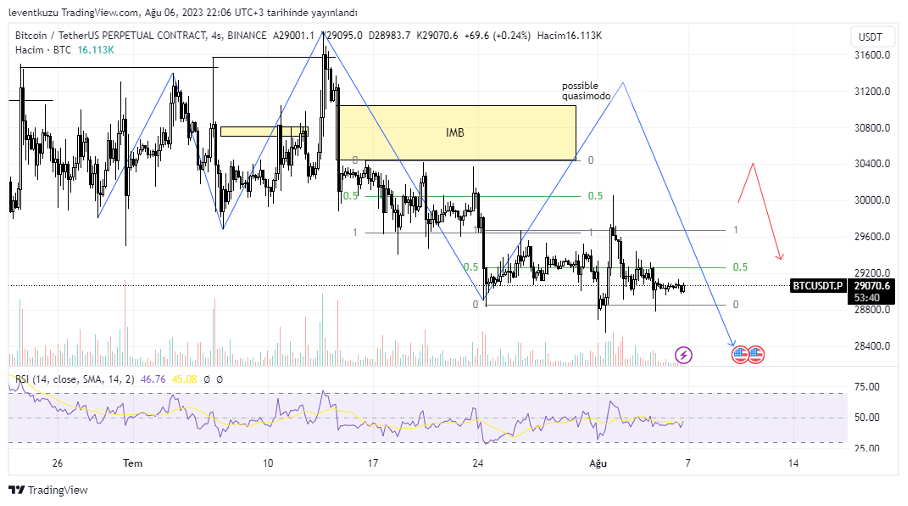
BTCUSDT
4H analysis
After making a movement towards lower prices from $31,600s, price of BTC formed a range and moved within it. Then, it was broken down and new range was generated at a lower price. The range was manipulated at both sides. There is still possibility for a possible Quasimodo pattern since there are open liquidities at higher prices and there is a fair value gap. On the other hand, market structure shifted to bearish on 4H. Bullish price movements will be for short entries for me by confirming on lower time frame.
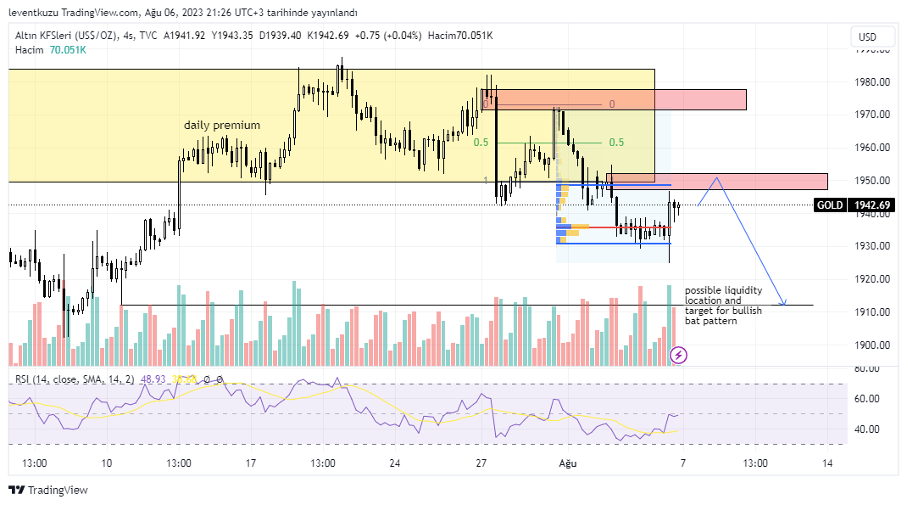
XAUUSD
4H analysis
Price movement obeyed well to our expectation. Price closed almost entire FVG candle occurred on 27th July and reversed to keep bearish movement. The price reversed from sell side order block. Price made a new break of structure towards the bearish attitude. Now we can identify a new bearish order block to make a new entry. VAH level of constant volume profile of the last leg down overlap in the same region. We have to confirm the movement in lower time frame. The possible will be the liquidity level at the shown swing low by a black horizontal line. It is also the D point of a bullish bat pattern that is not shown on the chart.
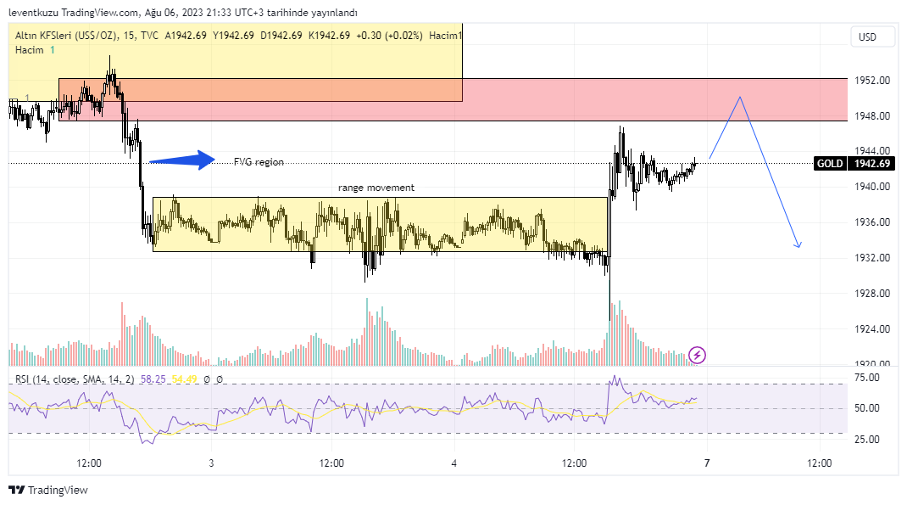
15 min analysis
The price was within a range for nearly two days with a shallow price difference of about $6. On Friday, price made a manipulation on both sides of the range, just with a single candle on 15 min. then, price filled the FVG that was from the last bearish movement. The bearish order block, shown by red box, seems a favourable place for short entry on 15-min chart. RSI will also possibly reach over-bought region.
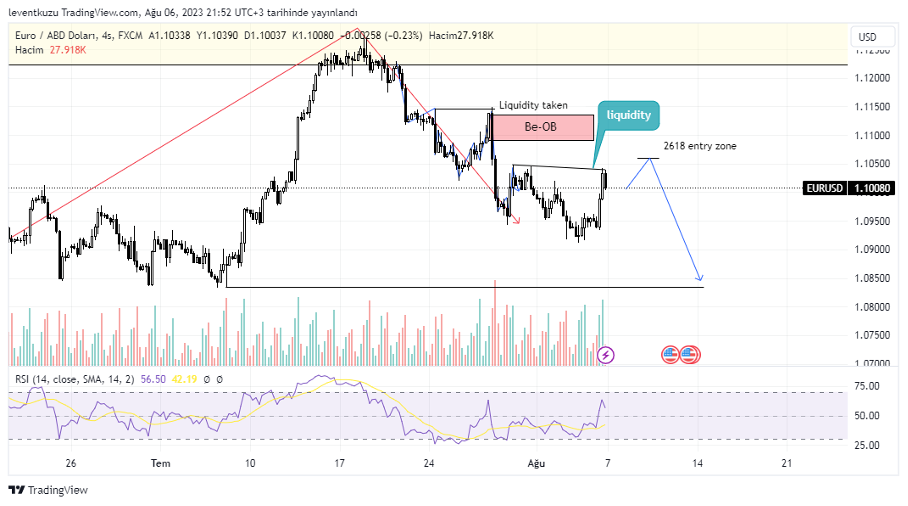
EURUSD
4H analysis
The market structure is still bullish on daily chart. The first target below can be the swing low that is shown by horizontal black line. In order to make this movement the pair should hunt the liquidities above. There are four candle wicks that moves lower than each other. The price of the pair should go above the highest of the wicks. After passing this level price could form a 2-618 formation. Also, the price can want to go higher prices and reach the bearish order clock that is shown by a red box. Short positions can be taken from that levels by lower time frame confirmations.
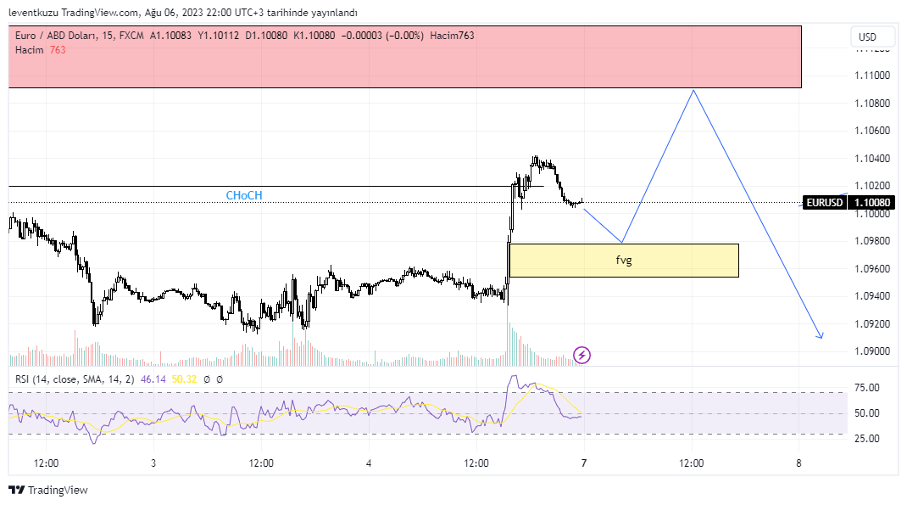
15 min analysis
There is a change of character on 15 min chart. Now the price in current time frame is bullish, price can reach to 4H bearish order block. But price left fair value gap before making a CHoCH. In this case, price of the pair can somehow drop and then reach Be-OB above and then continue bearish on 4H to reach the liquidity level around 1.085.
** Important Note: Above ideas are not investment advice!**
Nihat Çetinkaya
https://twitter.com/nhtctnk
I’m a private trader of over 7 years, based in Istanbul.
All trading and research are my opinion, not investment advice.