BTCUSDT
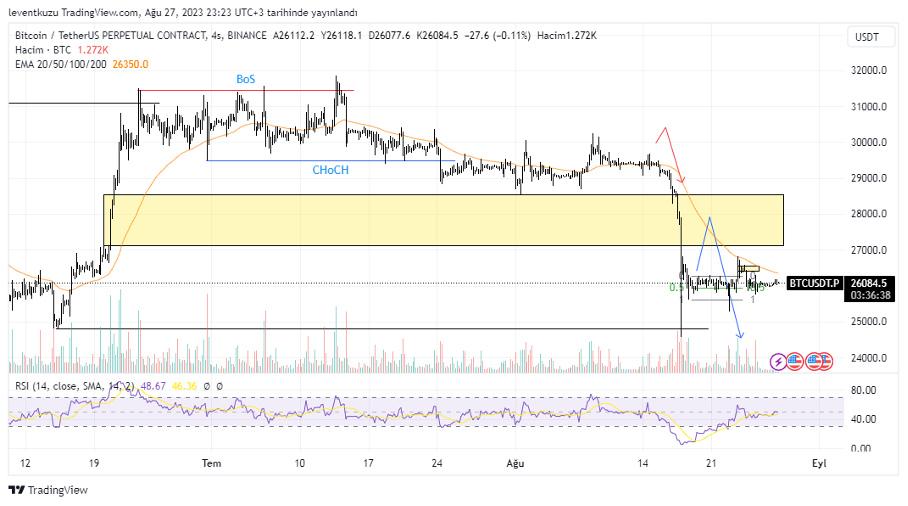
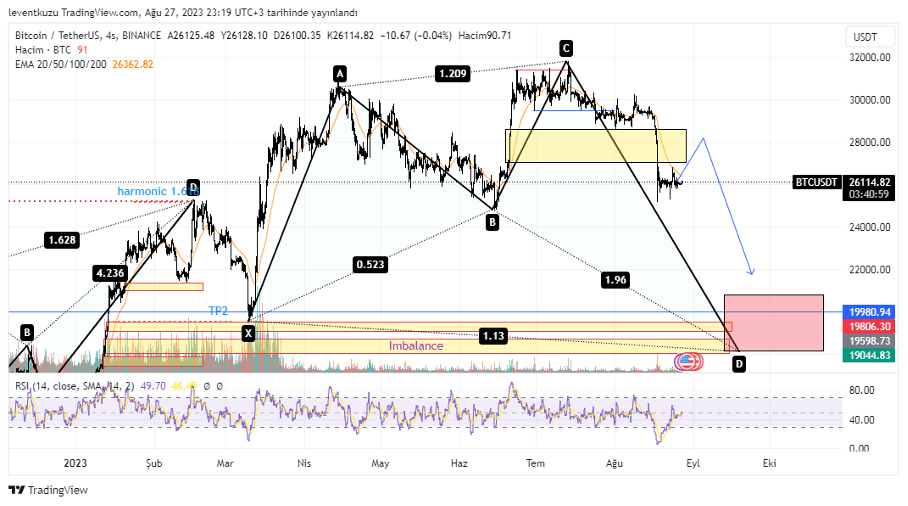
4H analysis
Last week, a probable bearish shark pattern formation was present and RSI was way too low to make a further lower price. Although the price is at the same level, RSI is in equilibrium now at 4H chart. But still in over-sod region for 1D chart. Since no significant price movement occurred last week, I have the same expectations and leave the chart below for possible price movements. Two different price comments are available this time as charts. The above yellow area is a point of interest for the price. But EMA50 held strong the price of BTC. We may still look bearish unless there is a strong upward price movement.
EURUSD
4H analysis
Although the daily market structure is bullish, the price of the pair swept almost all liquidity levels except swing low point. If the price reaches there, the candle should be examined carefully whether it is a liquidity sweeping or a candle close, which makes a change of character of the market. EMA50 is exhibiting an important resistance. The last liquidity level was not satisfactory to move the price upwards. Pair price 1.063 is important in current time frame.

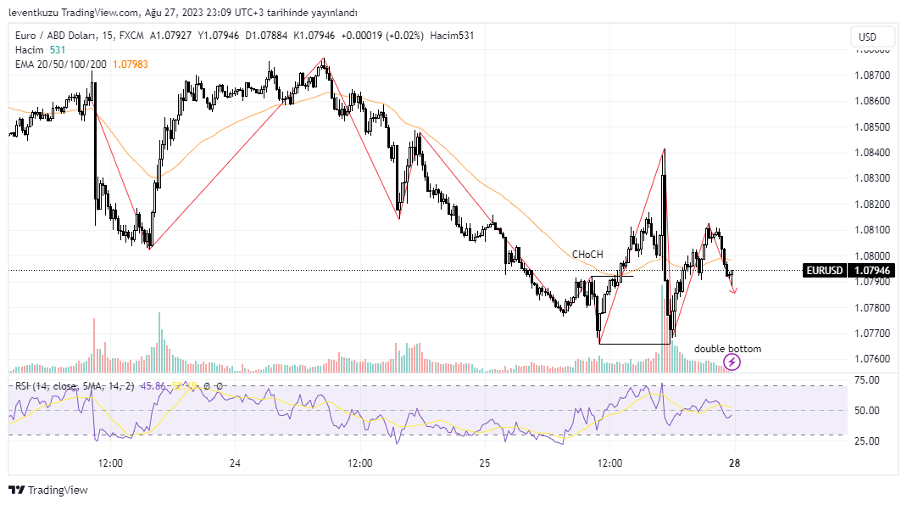
15 min analysis
Price made a bullish change of character on 15 minutes chart. Then, reversed by a sharp candle move. Price reversed from exactly the same previous swing low price. Therefore, there is a double bottom. Although, we may think that the 15 minutes structure is bullish, there is still possibility on HTF to reach lower prices. Long entries should be done by extra confirmations.
After forming the bullish shark pattern, price reached TP region and reversed from that level. After analysing the price structure, bearish structure is obvious. Current expectation is to reach 1.083 and possibly reverse from that price.
XAUUSD
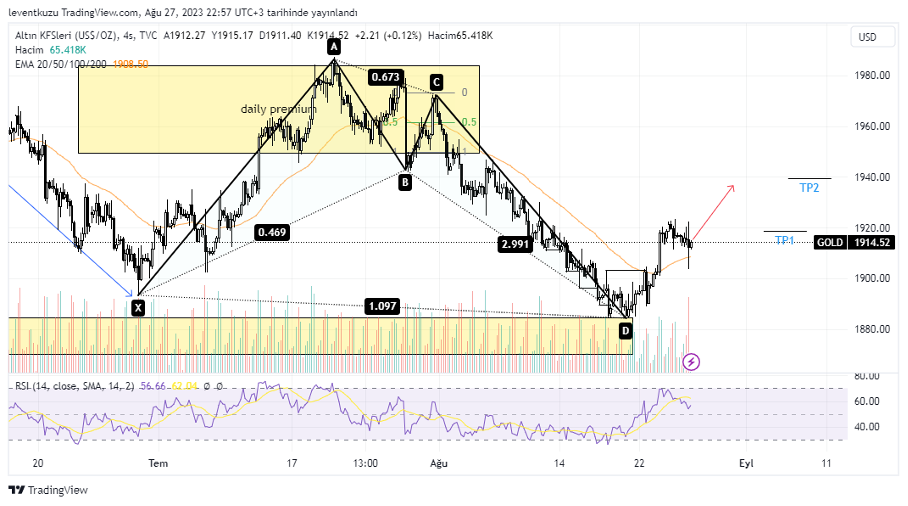
4H analysis
Price of gold swept most of FVG, available on weekly chart. A change of character was observed on 15 minutes chart and price turned to bullish. EMA50 was tested once and price reversed there, where it gave opportunity to long the pair. An extreme price movement was present on the last second candle. It removed FVG and price is free to keep its bullish structure. Take profit 1 point was flipped. The next target is TP2 region, which is approximately $1,940.
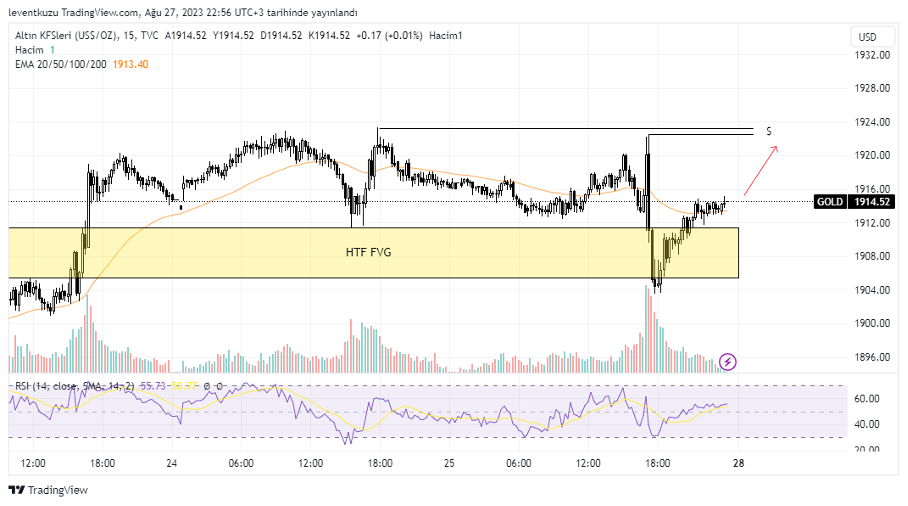
15 min analysis
FVG on 4H chart was swept and there is no more interest for to pair to go lower levels. After sweeping FVG, RSI reached the lower band. Then the price reversed and it went beyond EMA50 level. There are two important levels that attract the price. First, there is liquidity pool around $1,923. Second, there is $1,940 level for the harmonic pattern TP2.
** Important Note: Above ideas are not investment advice!**
Nihat Çetinkaya
https://twitter.com/nhtctnk
I’m a private trader of over 7 years, based in Istanbul.
All trading and research are my opinion, not investment advice.