BTCUSDT
4H analysis
The price path drawn last week worked well and shown on the chart by blue colour. Actually, price is within a range but made a quick manipulation including FVGs on two different directions. The first expectation shall be to balance these two FVGs by forwarding the price there. N the other hand, there are two open liquidities at higher prices. The sweeping of these two liquidities will also balance the price range shown on the left for HTF.
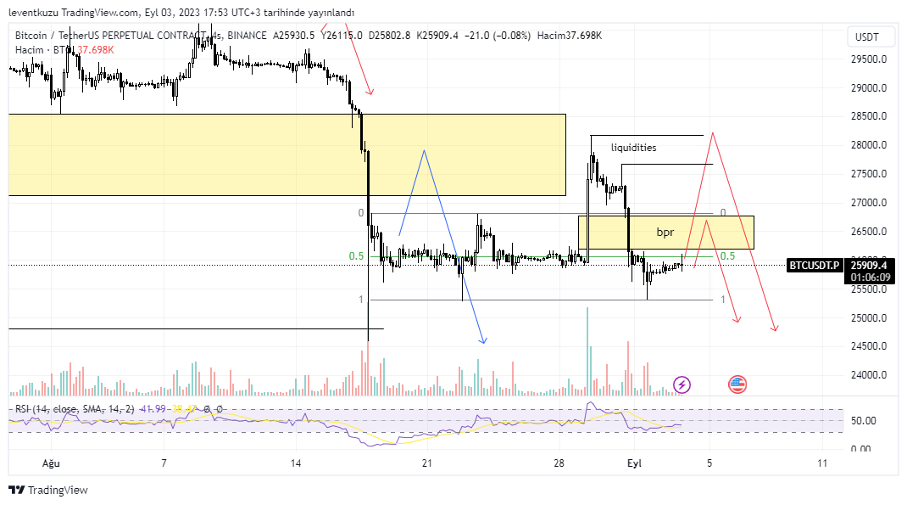
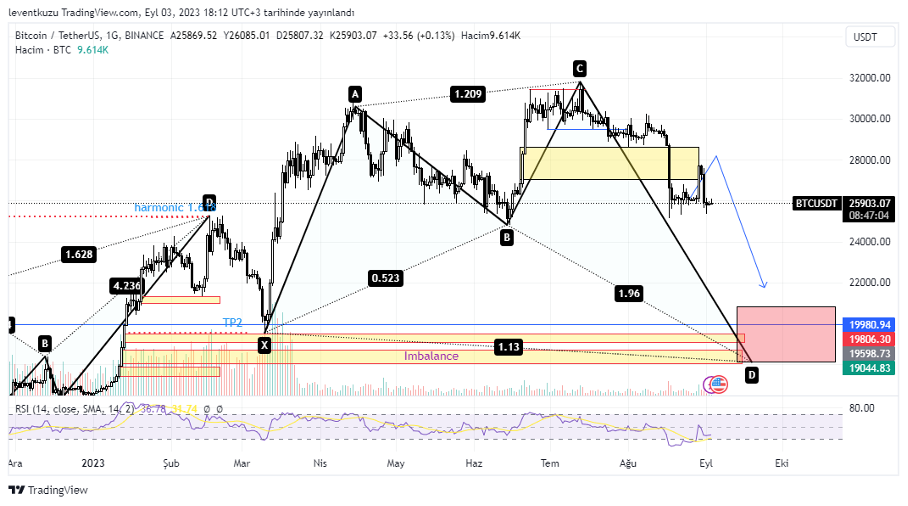
Daily outlook is given below. This chart is shared below 4H although it is a daily chart because this expectation is on a longer period.
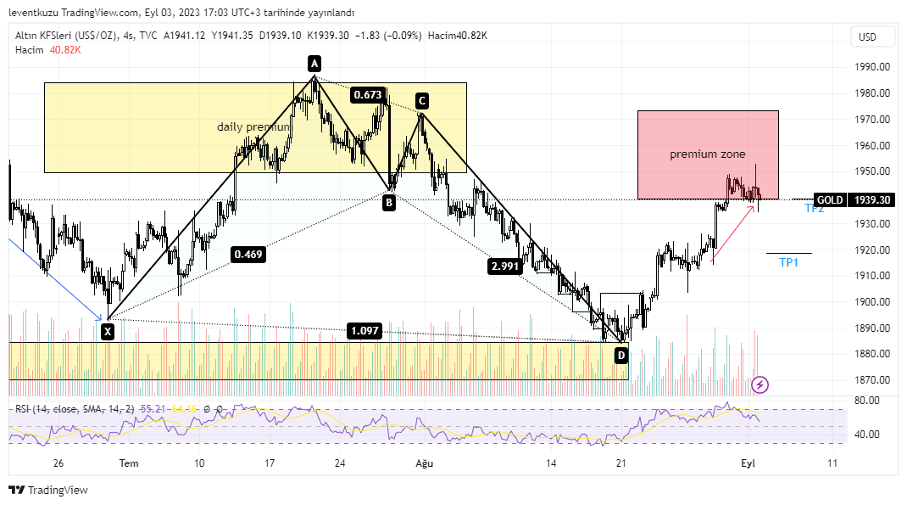
XAUUSD
4H analysis
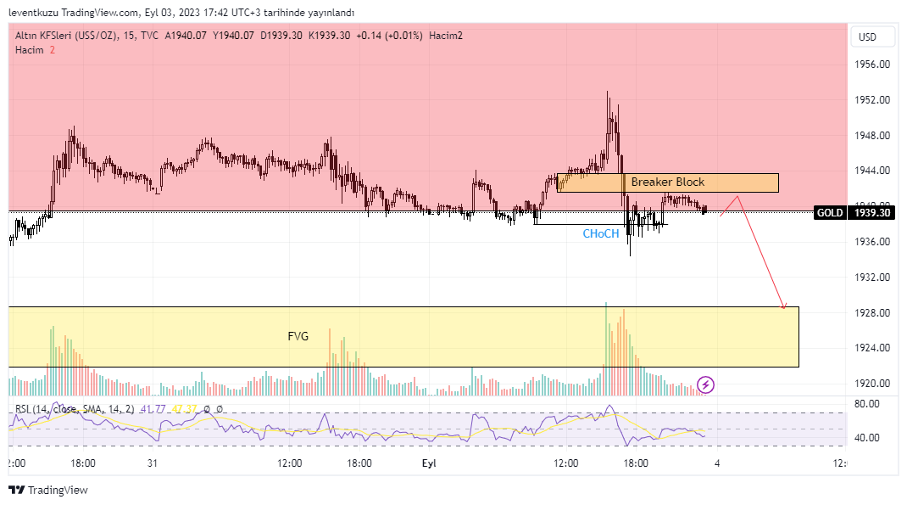
Bullish alternate bat formation was present on 4H. Expectation of possible price movement was as shown with the red arrow on the chart. Price reached TP2 of the formation. Now, formation was reached its ultimate target. The price is within a premium zone for 4H timeframe. There is additional daily premium zone which is shown by a yellow box on the left. Either zones were flipped. Current place of the price is critical because there is not a definite direction of the price. We have to look for possible confirmations on LTF.
15 min analysis
As there is not a clear direction of 4H, we may look for possible LTF entries on 15 min chart. Price made a change of character on 15 min chart. But this movement is just a wick on HTFs. Therefore, it is best to be cautious in entering positions. Another good point is that breaker block worked well and price reversed from that zone. But still can try to reach the same zone. If the price cannot pass through breaker block, then the target will be the imbalance which is shown by yellow box below.
EURUSD
1D analysis
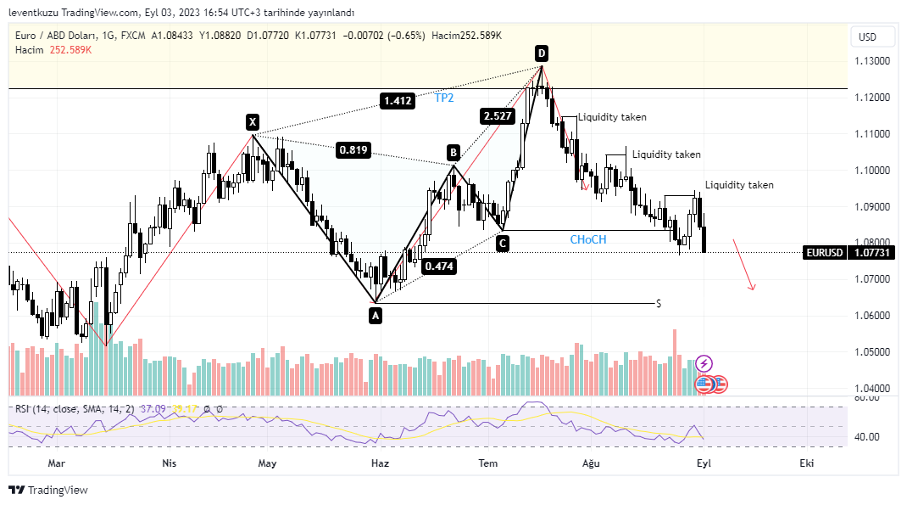
There was a butterfly formation on daily chart. Price reached TP2 region and continued beyond it. Also, market structure reversed on daily. The price is bearish and there is a liquidity at point A of the harmonic formation. It is likely that price wants to reach that location. But in a LTF view a little retracement can occur, which is shown in 1H analysis.
1H analysis
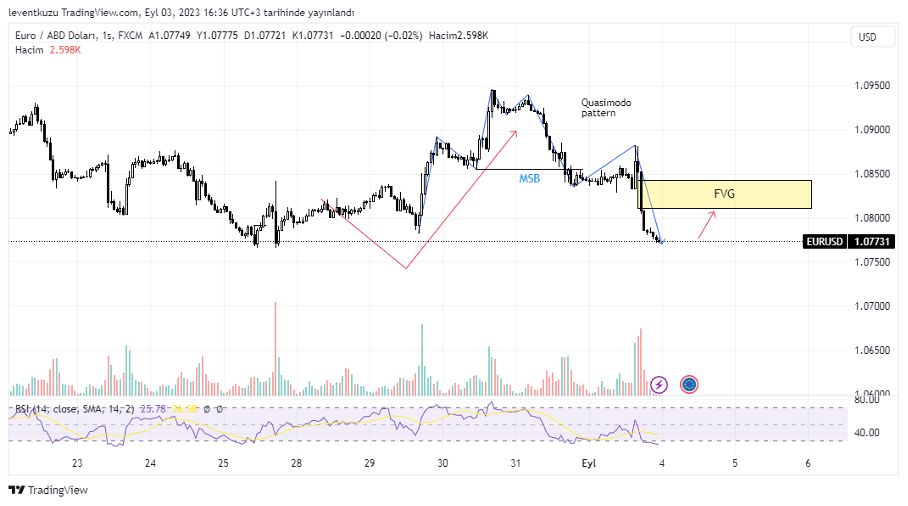
The price expectation of last was shown by red path and left on the chart. The price obeyed the path that was shown on 4H chart. However, liquidity still exists at around 1.063. A clear Quasimodo pattern occurred on the chart and reached its target. Before reaching the target, imbalance was left through the price movement. We may expect a rise up to the region shown as FVG, which may leave a 0.5% gain. After reaching the target, we have to look at the state of the price since there is still liquidity below.
** Important Note: Above ideas are not investment advice!**
Nihat Çetinkaya
https://twitter.com/nhtctnk
I’m a private trader of over 7 years, based in Istanbul.
All trading and research are my opinion, not investment advice.