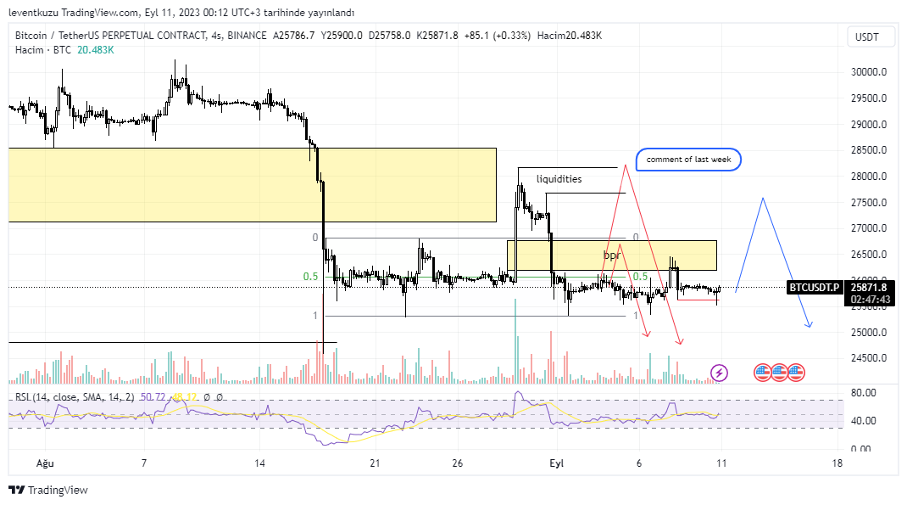
BTCUSDT
4H analysis
Expectations of last week was shown by two different red paths. The first path was reached but price reversed to its starting point. The price recent swept liquidity that was shown by the red horizontal line. There is still possibility for the price to make an approximately 3-9% profit. But on HTF lower prices are the main target.
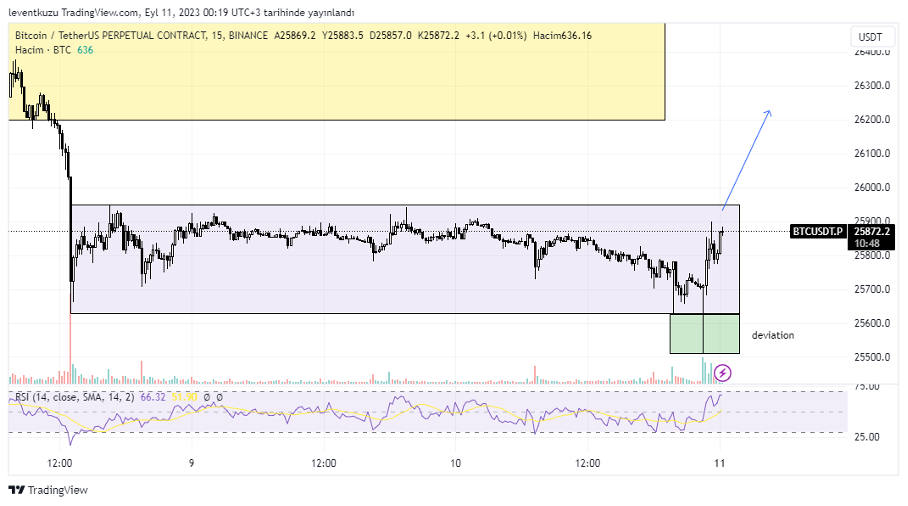
15 min analysis
The price is in a range for about two days. A deviation occurred recently, which triggered some stop-loss orders. Now the price has some liquidity to move over the range value. 4H targets around $26,500 and $28,500 can be reached on short term.
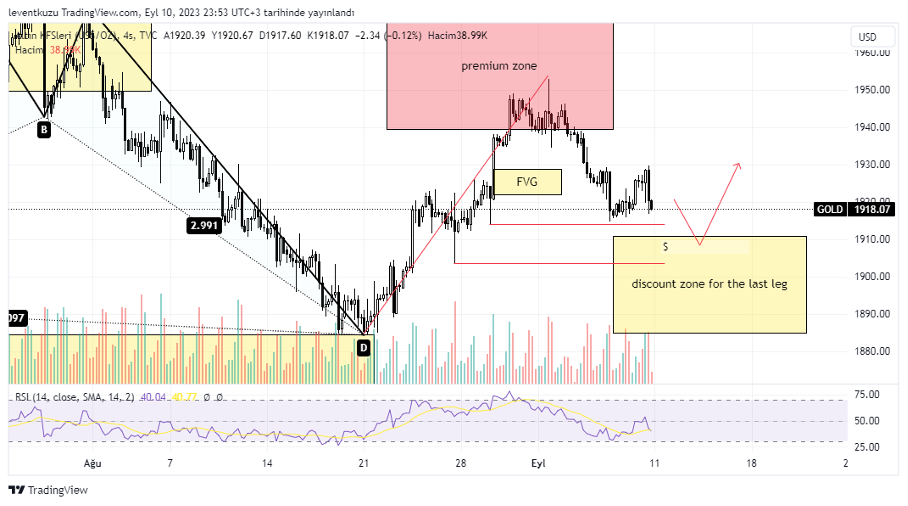
XAUUSD
4H analysis
The LTF of last week provided a successful short entry last week. Our expectation was to reach FVG shown on the chart from the premium zone since there was a bearish market structure break on 15 min. Now we have a discount zone for the last leg between $1,910s and $1,890s.The possible target is there and there are two liquidities which can be swept. Reverse of the price depends on the behaviour of the price after liquidity sweeping.
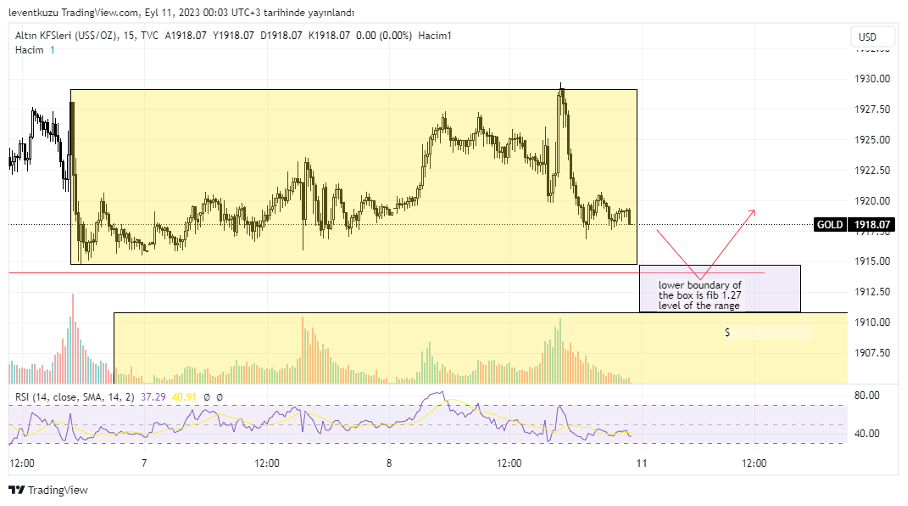
15 min analysis
Price seems to make a range movement for some time on 15 min chart. Liquidity was taken from top of the box. The price is now close to the lower boundary of the range. The price can make a deviation from the lower edge of the range. In this case, price can go down to fib 1.27 level. It definitely intersects with the discount zone of 4H chart. Also one of the liquidities will be swept. Therefore, the price is more likely to move towards lower values. Reversal of the price should be confirmed by LTF market structure break.
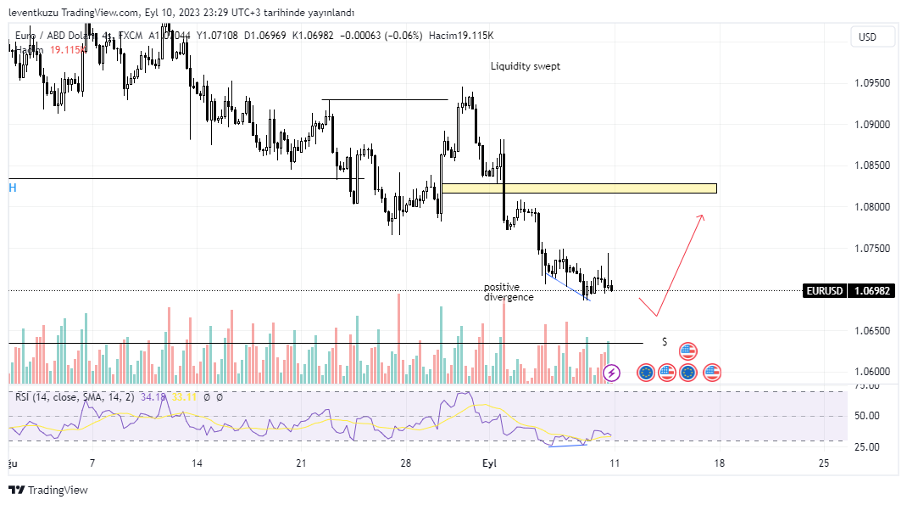
EURUSD
4H analysis
In the hourly analysis USDEUR pair we mentioned a possible zone at 1.0808 where can price reach. The target was hit by a wick and continued its bearish structure. 4H chart is available this week due to the fact that it shows the current state of the price better. Now the possible target is the yellow box around 1.082. There is also positive RSI divergence on 4H, which is a sign for possible structure reversal. We should also consider the liquidity level below which is yet close the price. A 0.6% drop in the price will be enough to sweep the liquidity. My idea on 4H is shown by the red path.
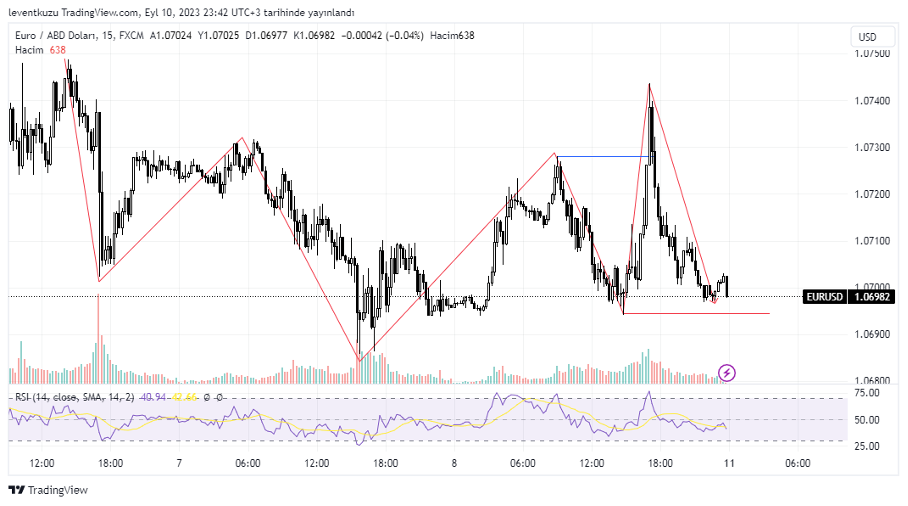
15 min analysis
Bearish market structure reversed and it seems like that there is a MSB on 15 min. But when we shift to 1H chart, we can realise that it just swept liquidity of a previous wick. In this case we should observe what will happen around the horizontal red line. It can also a MSB on 15 min chart. If this occurs, then we may still expect the liquidity which was already commented on 4H chart and previous movement is an inducement due to liquidity sweeping on HTF.
** Important Note: Above ideas are not investment advice!**
Nihat Çetinkaya
https://twitter.com/nhtctnk
I’m a private trader of over 7 years, based in Istanbul.
All trading and research are my opinion, not investment advice.