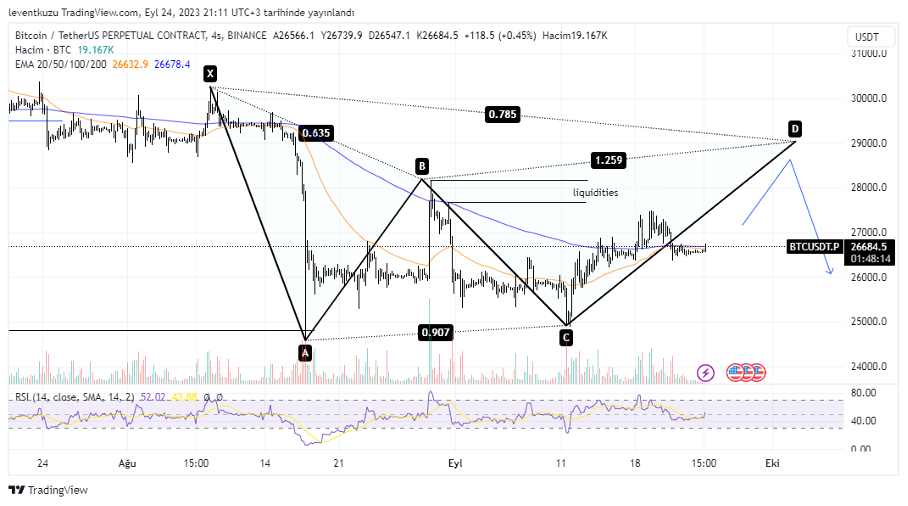
BTCUSDT
4H analysis
Much not changed for BTC since last week. Price moved a bit higher to the D point of possible Gartley pattern. We can also observe a possible upward price movement if EMA50 crosses over MA200. Currently, price is so close to make this movement. In this case $29,000 will be a possible target. Then, we may expect a price reversal. In our previous HTF charts, $21,000s was our long term target.
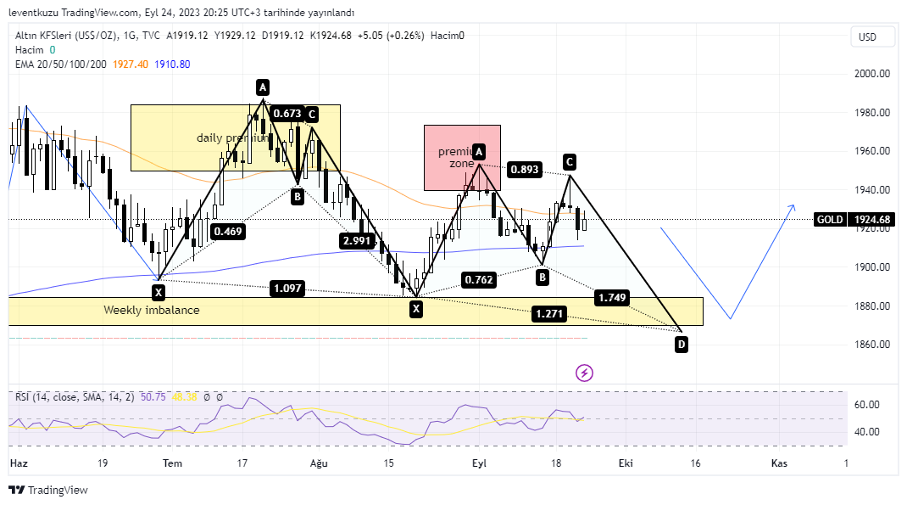
XAUUSD
1D analysis
After the formation of bullish bat pattern, price reversed from premium zone of the harmonic formation. The price reversed to around fib 0.786 level of the price. Then, we can observe a pullback until fib 0.886 level. Now the price seems to reverse from that level. This looks like a bullish butterfly pattern. If the formation is realized , then we may expect a price move down to $1,870s. This will also help to sweep the left weekly imbalance in that zone. But you should keep in mind that this is now just a possibility.
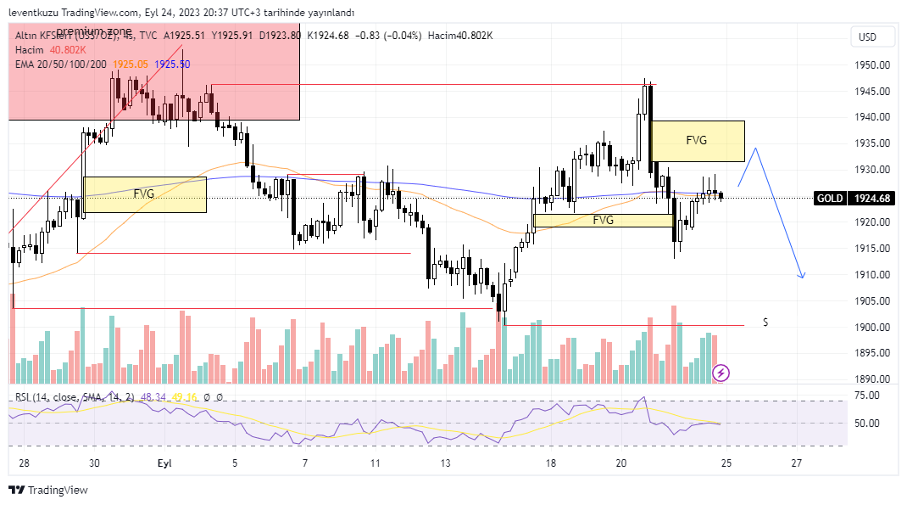
4H analysis
Gold price reactions occur according to sweeping open liquidities. Observing the one-month long chart on 4H it is clear that the levels were swept by price movement, which is shown by red colour. A new liquidity is available around $1,900. There is a fair value gap over the current price between $1,930-$1,940. The probable price movement can be first moving into FVG zone than a move until $1,900s. Short time frame price entry always have to be ensured for an actual position.
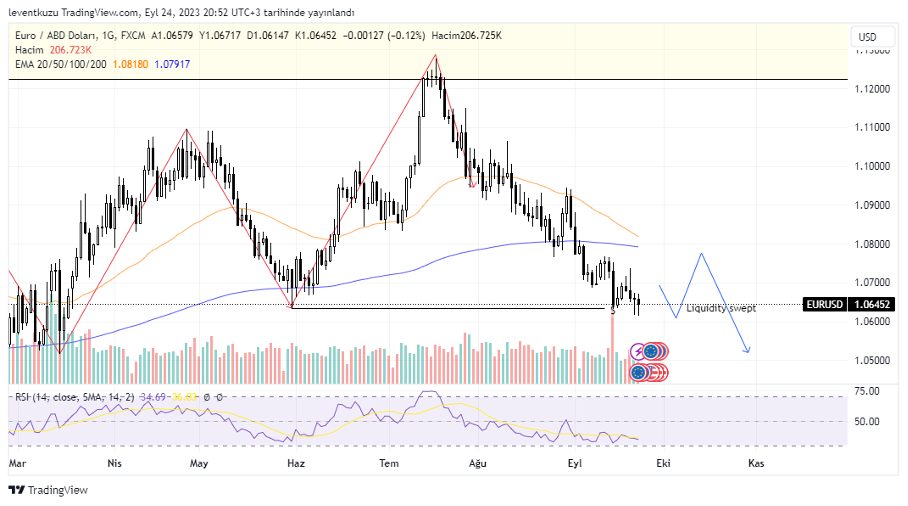
EURUSD
1D analysis
AB=CD formation occurred ono daily chart and price reversed. EMA 200 level, somehow, helped the price to react. But its momentum was not enough. EMA 50 acted as a barrier and pair price continued its drop. An important liquidity level was swept. We are now at a critical point. Here, we will see if a change of character will be formed or not. If it breaks the level below, then we can expect a price path as shown by the blue color. Moving averages also seem to exhibit a possible price reversal.
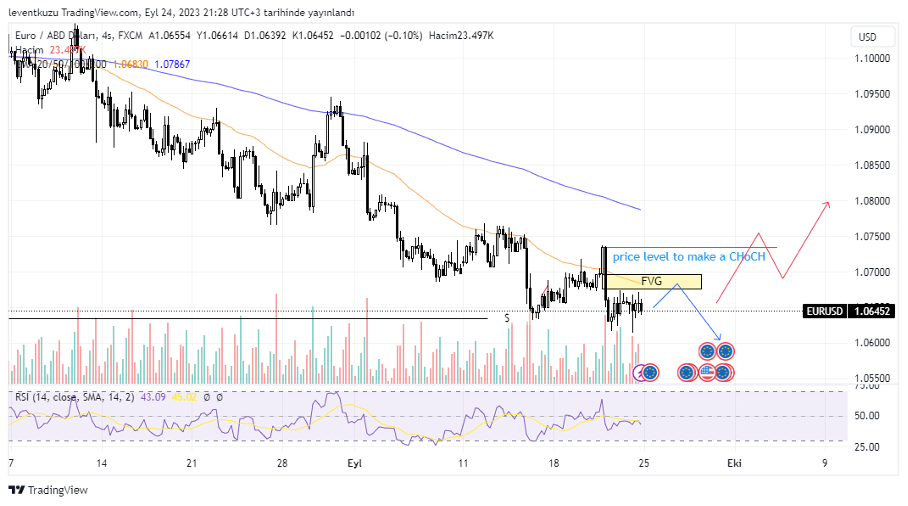
4H analysis
Pair price is in a downtrend until mid-July. It had several attempts to crossover EMA200 but those were unsuccessful. EMA50 is pushing the price down and a place that could make a change of character is shown by a red horizontal line. Although bearish character is present on 4H chart, lower prices can show a more reasonable character change on HTF. The most remarkable price movement can be sweeping the FVG between 1.067 and 1.070, then move to lower prices.
** Important Note: Above ideas are not investment advice!**
Nihat Çetinkaya
https://twitter.com/nhtctnk
I’m a private trader of over 7 years, based in Istanbul.
All trading and research are my opinion, not investment advice.