BTCUSDT
4H analysis
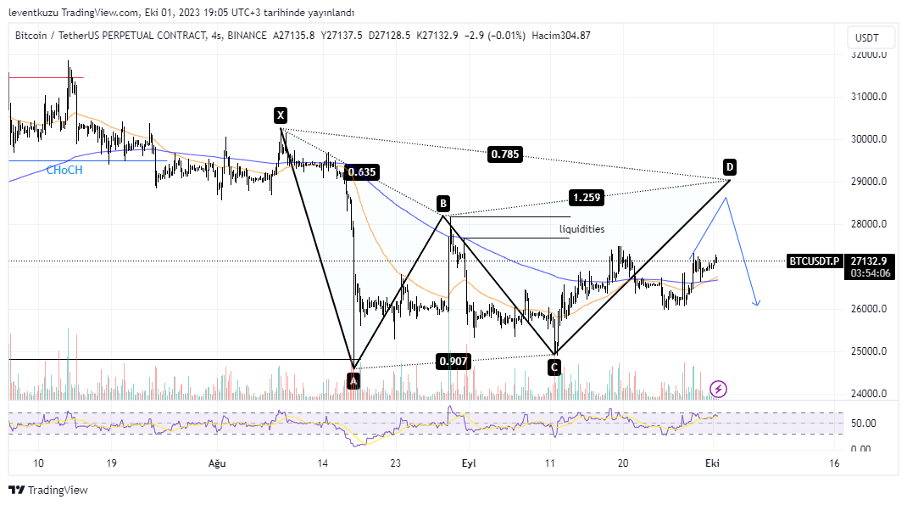
BTC chart expectation has not changed for the last two weeks. Price moved a bit higher to the D point of possible Gartley pattern. Additional change of the week is the cross of EMA50 over MA200. This fact is important for the price to move to higher prices but not an exact indicator alone. The possible target is $29,000. Then, we may expect a price reversal. In our previous HTF charts, $21,000s was our long term target.
15 min analysis
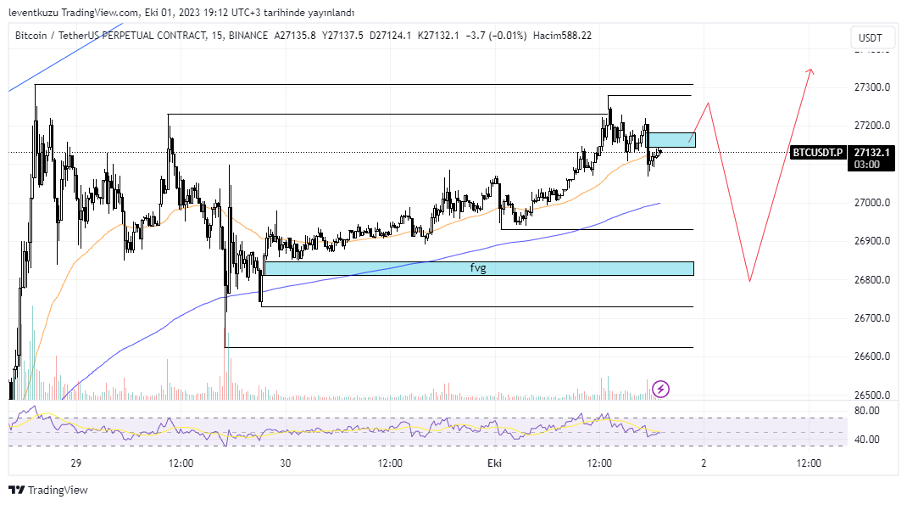
On 15min chart, BTC can exhibit a quite complicated movement. There are several liquidity and fvg zones. These two factors are the most important factors that drive the price of BTC. The price may want the reach the nearest POIs and then move the further POIs in internal structure. After that, HFT POıs can be the active targets.
XAUUSD
1D analysis
We pointed out the possible formation of bullish butterfly pattern and the target was fib 1.27 level of x-a leg. Also, there was the weekly imbalance around the same price. Therefore, it was likely for the price to reach that level. Price hit the level and went further, it is close to 1.618 level of the bullish butterfly pattern. By also taking into account the daily rsi, the price is likely to reverse from current prices. The possible target for the price is shown by a red rectangle. The range is between $1,883 and $1,916

15min analysis
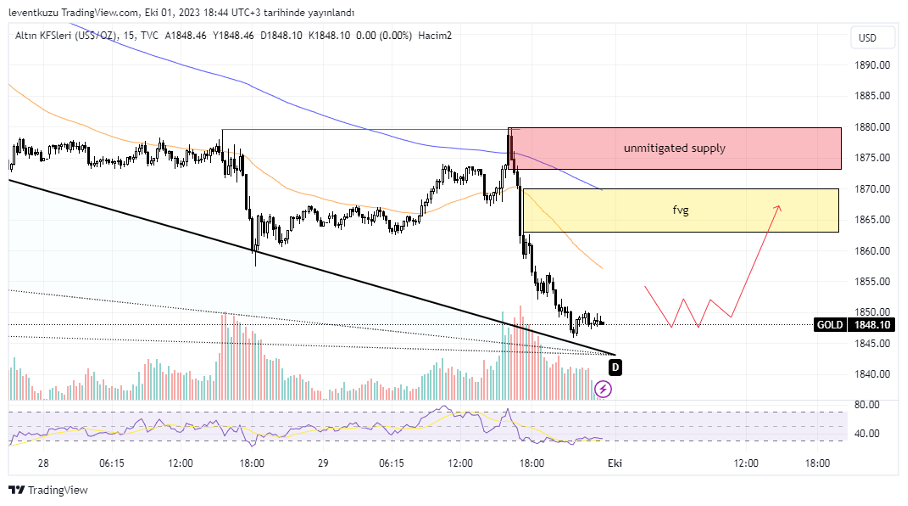
Before the last down movement, gold swept liquidity as it did usually. The structure is still bearish in LTF. According to HTF analysis, current price zone seems to be the probable lowest prices for LTF. Price can hit two POIs above, which are FVG and unmitigated supply zone. The upper level of the supply zone is also the fib 0.382 of HTF harmonic pattern.
EURUSD
1D analysis
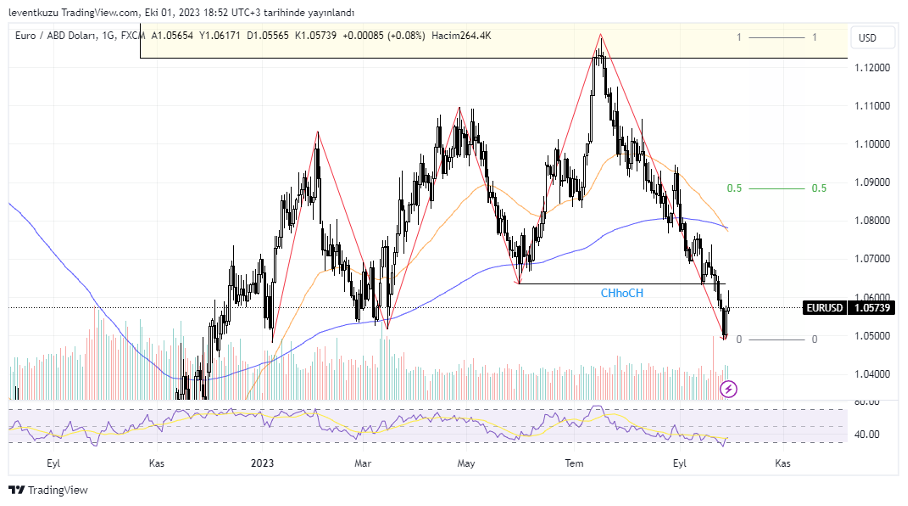
The expectation of our last week analysis was to continue of the price on daily chart. It well obeyed the expectations and moved lower pair values. We emphasized that CHoCH was unclear last week but there is an exact change of character at the moment. Another factor is that EMA50 crossed EMA200 downwards. This is also another indicator of market structure shift to bearish conditions. RSI level shows that price can reverse rom current level. The region between fib 0.5 and 1.0 is the premium for the price and can be used for a possible short position. Exact fib 0.5 level is 1.088.
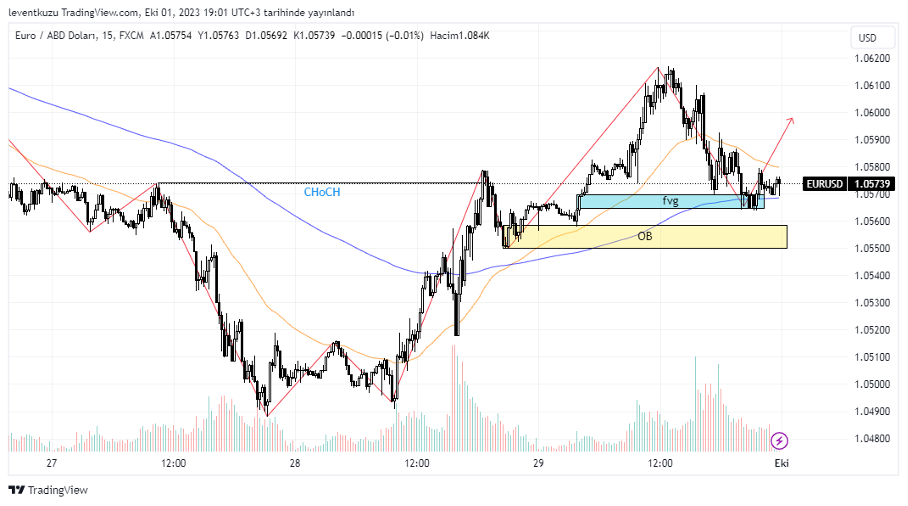
15min analysis
There is a change of character on 15 min chart. The structure is bullish. Price is continuing its move by making break of structure. The last bullish order block was tested twice and the fvg zone above it was completely filled. EMA200 is holding the price. It is expected that the pair price can move higher pair prices in order to reach HTF target.
** Important Note: Above ideas are not investment advice!**
Nihat Çetinkaya
https://twitter.com/nhtctnk
I’m a private trader of over 7 years, based in Istanbul.
All trading and research are my opinion, not investment advice.