BTCUSDT
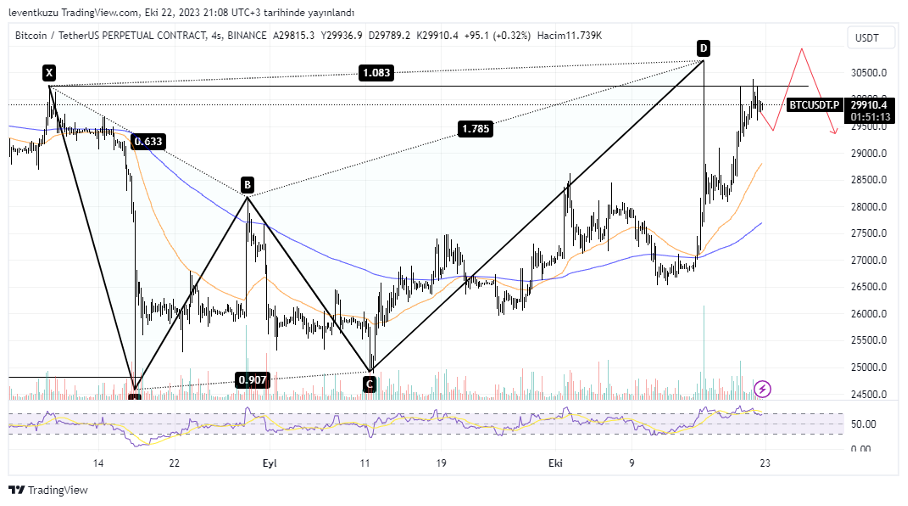
4H analysis
Although shallow movements were present on the BTC chart, a severe movement was present last week by a fake news. The price anyway kept is gradual upward movement after severe fall. $30,250 is of quite importance. A candle close over that value will make a change of character. Then, we may expect $27-28ks for a pullback. Further price movements can be up to $32-33ks. This is valid if CHoCH occurs. Unless, lower prices will be the target.
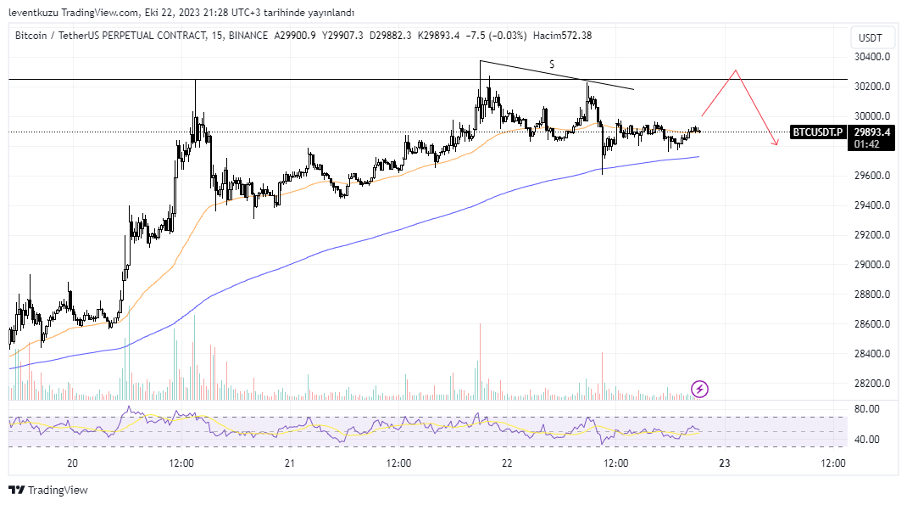
15 min analysis
As with the HTF analysis, $30,250 remains a critical zone. Several liquidities were left by previous price movements by wicks. Price can move to that targets to trigger stop loss of several short positions. EMA50 is moving close to EMA200 and RSI started to drop. This shows us that after an upward movement, a pullback will occur.
XAUUSD
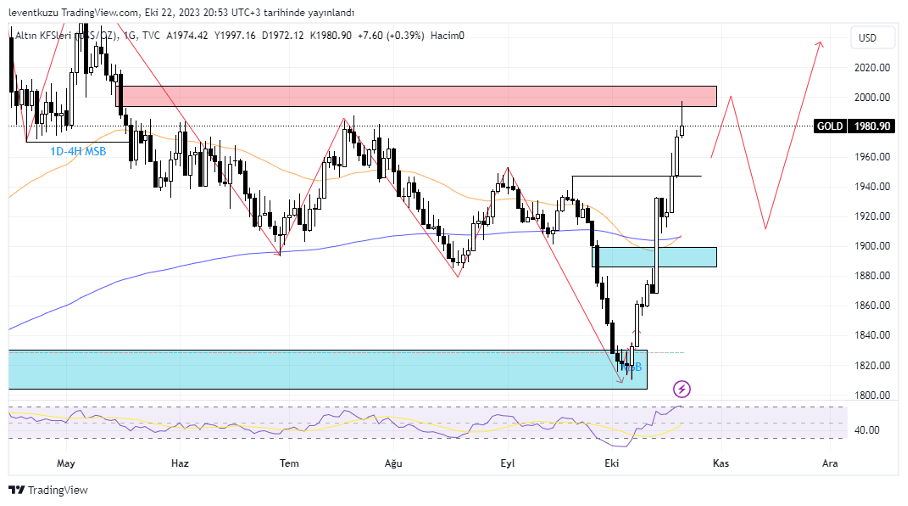
1D analysis
Price of gold was over the blue zone, around $1,930s. The bearish candle was not strong enough to reach that zone. Price reached the liquidity and reached the fair value gap that is shown by red colour. We also observe a character change ın the daily chart. $1,880-1,900 zone can be a reversal zone and long setups can be formed for further price movements.
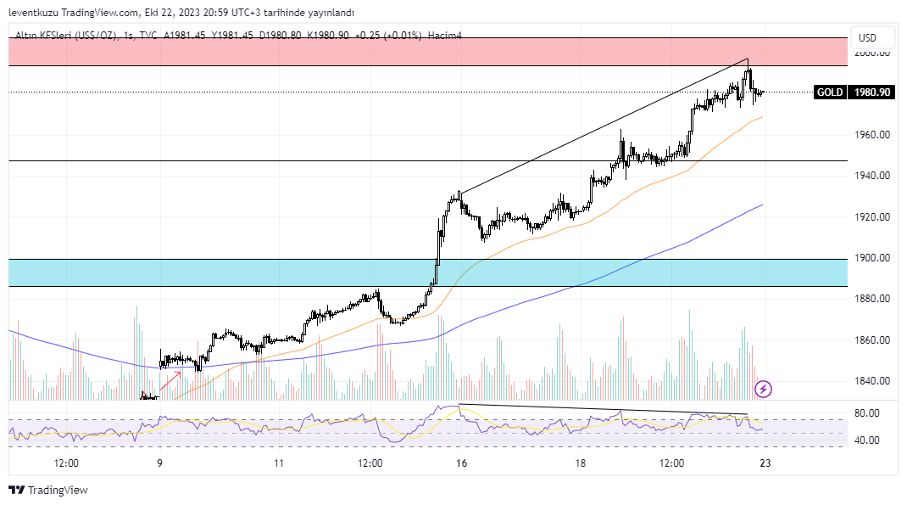
1H analysis
Price did not show any weakness in the hourly chart. EMA50 is over EMA200 and the difference is quite uniform. Additionally, there is no reversal on the market structure. The only negative appearance is the bearish RSI divergence. Upward momentum of the price is dropping as the price increases. A reversal movement can drive the price down to $1,900s.
EURUSD
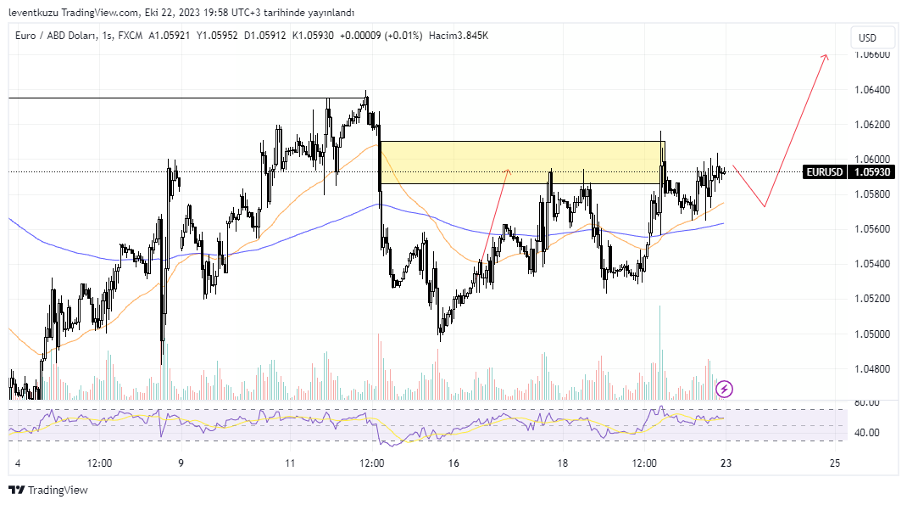
1H analysis
The predefined fair value gap worked well and it was fully swept by the candles. EMA50 was lower than EMA200 for a long time. We realize a reversal of the trend in the current setup. A harmonic pattern is also formed. EMA200 of the hourly chart is in accordance with fib0.5 of the formation. We may keep to see a forward price move from 1.057s. On lower time frame, confirmation can be sought whether pullback will happen or not.
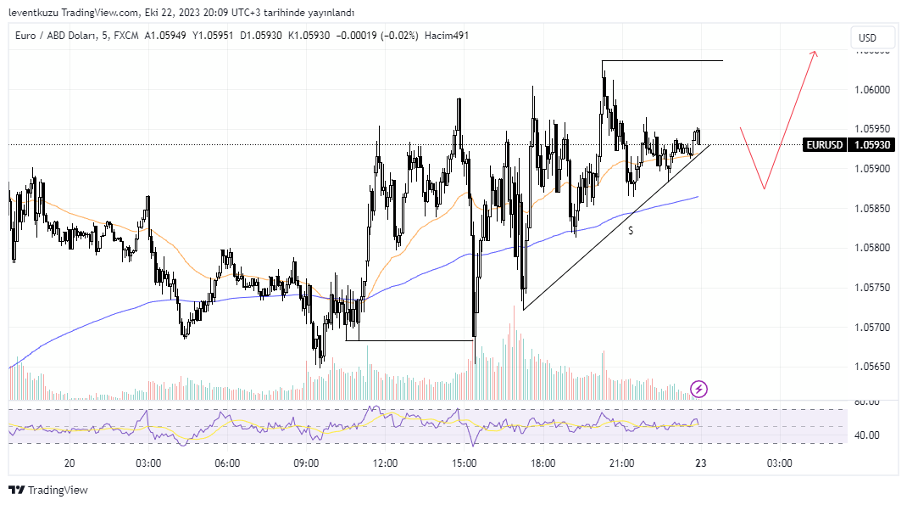
5 min analysis
On LTF chart, the obvious movement was occurred by attacking liquidity prices. Although sharp movements were observed, the price reversed by an equal acceleration on the opposite direction. Due to quick price movements, EMA200 held the same inclination. Some more liquidities are present in the current chart. Price seems to sweep the liquidities at lower prices and move to higher pair value, compatible to HTF chart.
** Important Note: Above ideas are not investment advice!**
Nihat Çetinkaya
https://twitter.com/nhtctnk
I’m a private trader of over 7 years, based in Istanbul.
All trading and research are my opinion, not investment advice.