BTCUSDT
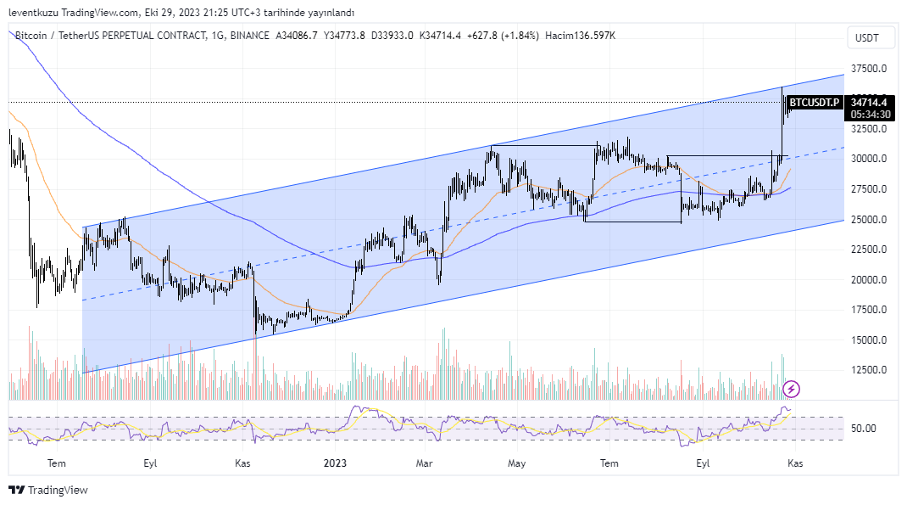
1D analysis
BTC moves within an ascending channel for one year. Total gain from the lowest point of the channel has passed 100%. RSI dips always worked as a buy signal whereas RSI over 70 was a sell signal. We observe that the second highest RSI was reached in this chart. Anyone with long positions should be careful from now on. A correction until EMA200 is possible.
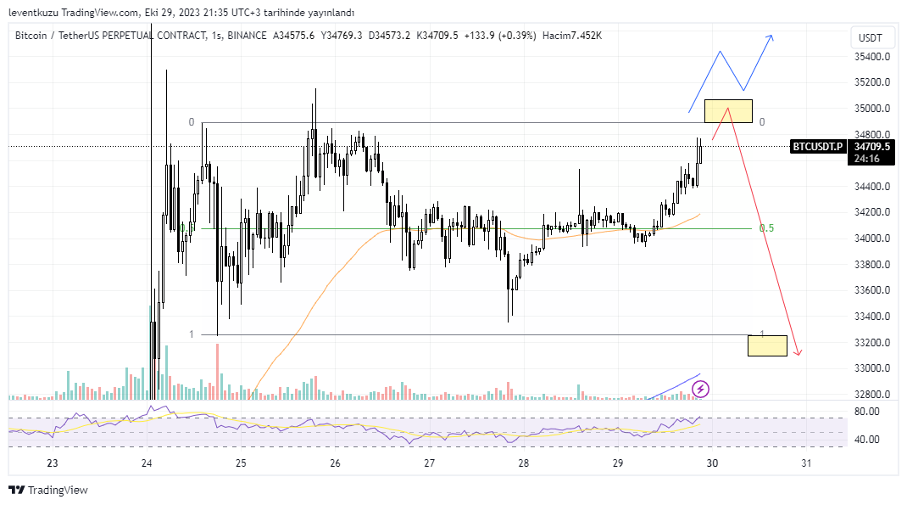
1H analysis
After the strong move, BTC is moving within a range. The higher boundary was manipulated once now the price is close to the upper boundary again. A new manipulation is possible. If it is just a manipulation, then price can reach to range low. However, if the price stays above the range high, then higher prices can be reached. But HTF analysis warns us for a possible reversal. The most likely price movement can be as the arrows with red colour.
XAUUSD
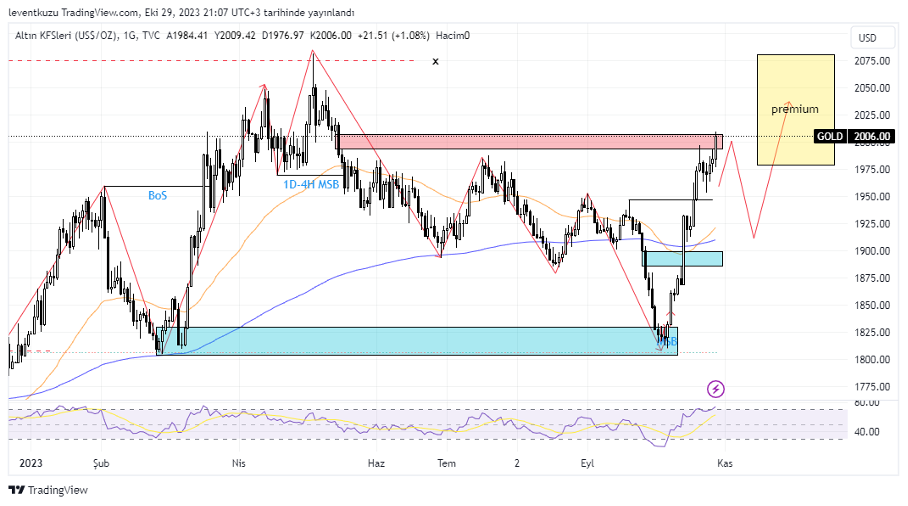
1D analysis
Price of gold kept well the expectations by reaching the red zone around $2,000. This price movement made a market structure shift. Price is in the premium zone. We may expect a price drop until $1,880-1,900 zone, then price can go higher values.
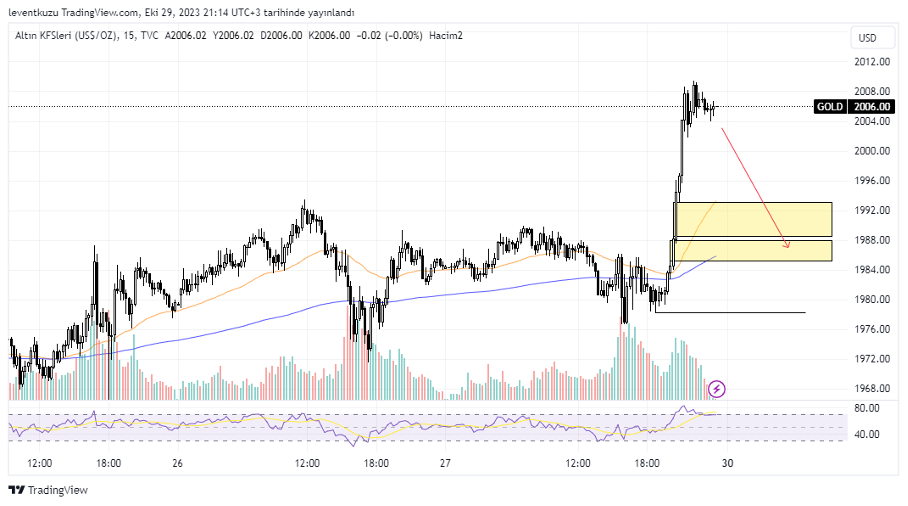
15min analysis
Price recently exhibited a bullish movement on 15 min chart. If the triangle was uniform, we could also expect a bullish movement. But the triangle is not convincing. Fair value gap zones and liquidity is the short term target.
EURUSD
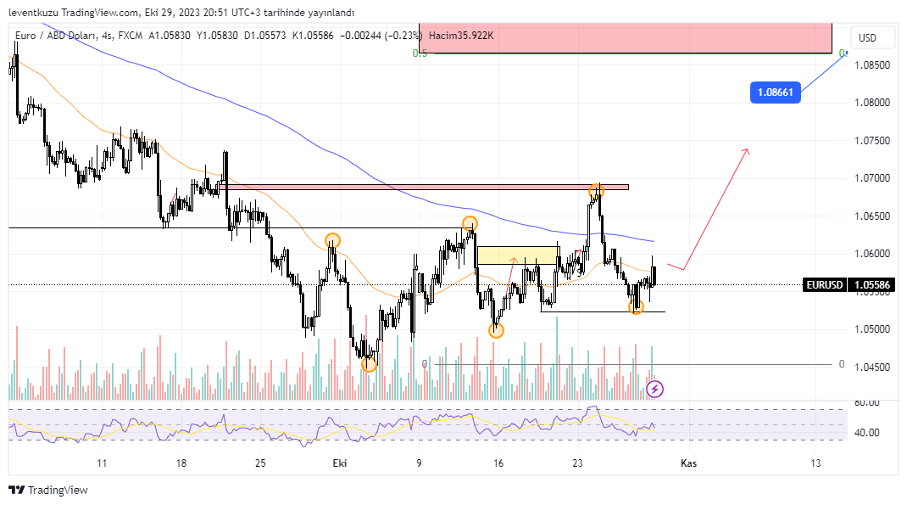
4H analysis
As the highest time frame, we had 1H analysis and were expecting the price to rise. Actually, it was realized and the price moved back to the same level. When we observe 4H chart, it is clear that this is a movement just to sweep liquidity. The highest price that reached corresponds to a fair value gap. Another factor is that price is leaving higher high and lower high swing points which are shown are orange circles on the chart. This is a bullish market structure on 4H chart. 1.086 is the premium zone for a daily chart and pair price can reach there unless a change of character is observed.
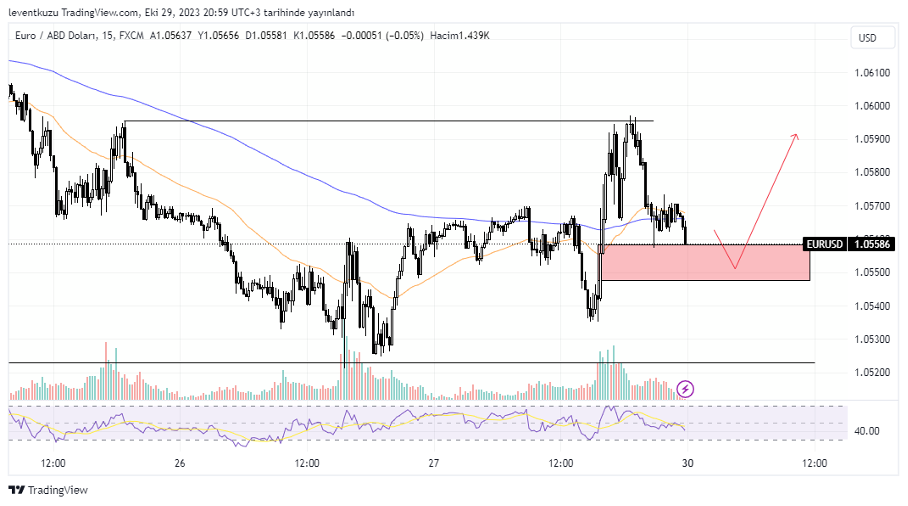
15 min analysis
On 15 min chart, another liquidity was obviously swept. Now, we observe downward candles that try to reach the fair value gap zone below, which is shown by red rectangle. EMA50 crosses EMA200 and ready on LTF for bullish movement. After filling FVG, price is expected to move higher pair prices.
** Important Note: Above ideas are not investment advice!**
Nihat Çetinkaya
https://twitter.com/nhtctnk
I’m a private trader of over 7 years, based in Istanbul.
All trading and research are my opinion, not investment advice.