BTCUSDT
1W analysis
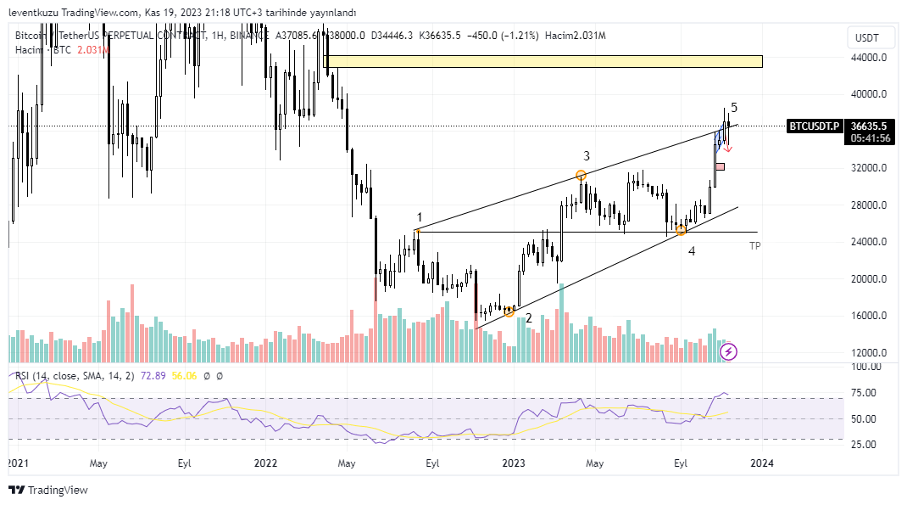
We mentioned about a Wolfe pattern on the weekly for two weeks. The fifth touch of the waves manipulated the trends on the pattern and a retest was occurred. We will see if the price will want to continue its movement after retest, which will cancel Wolfe formation or this is just going to be a manipulation. If the price continues to higher levels, $42,000 will be the target due to weekly fair value gap. But we should consider the saturation of RSI. The target on bearish side is TP for Wolfe, which is $25,000 on long term. Short term charts should be considered for position entries. Higher time frame charts avail us to see the possible main price pathways.
4H analysis
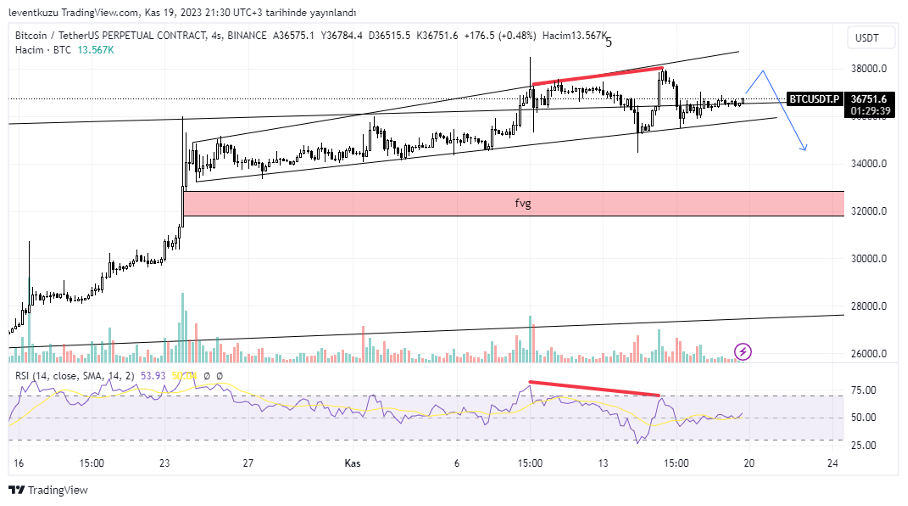
We commented the price movement as a parallel channel previously. Now a clear ascending broadening wedge is available on the chart. This is a bearish formation. Another bearish sign is the bearish RSI divergence. If the price drop occurs, then the target will FVG below shown with the box, which is around $33,000.
XAUUSD
1D analysis
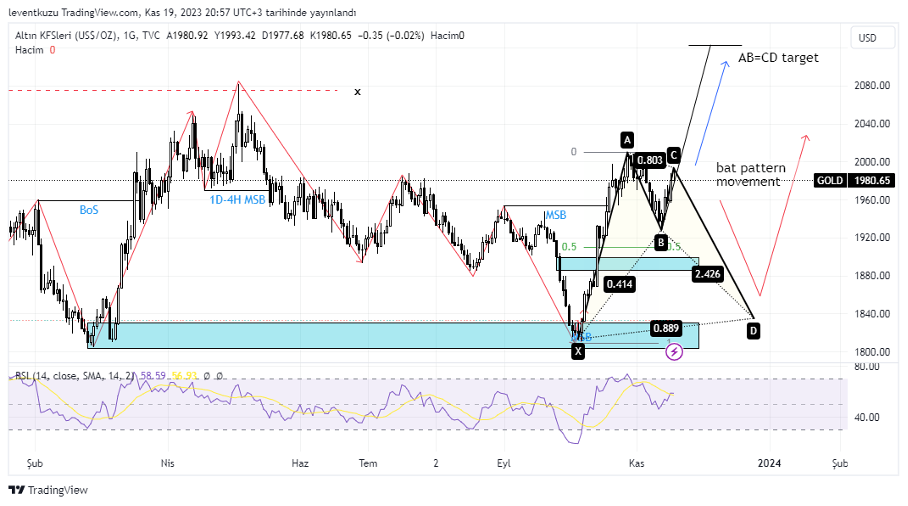
Two possibilities are present on daily chart. We know that the structure turned to bullish. Somehow the price will go higher levels but the pattern is important. Short term charts are more decisive in this case. But HTF projections can highlight are major road. One is AB=CD formation, which has $2,120 target. If we consider current RSI level, this price can be reached. On the other hand a bat harmonic pattern is also possible. If it occurs, then the price can move down to $1,840 to the previous mitigated order block. By the second path, the blue zone around $1,890s can be filled. After all, price can increase to higher values. As there are two distinct paths, we have to decide according LTF charts.
1H analysis
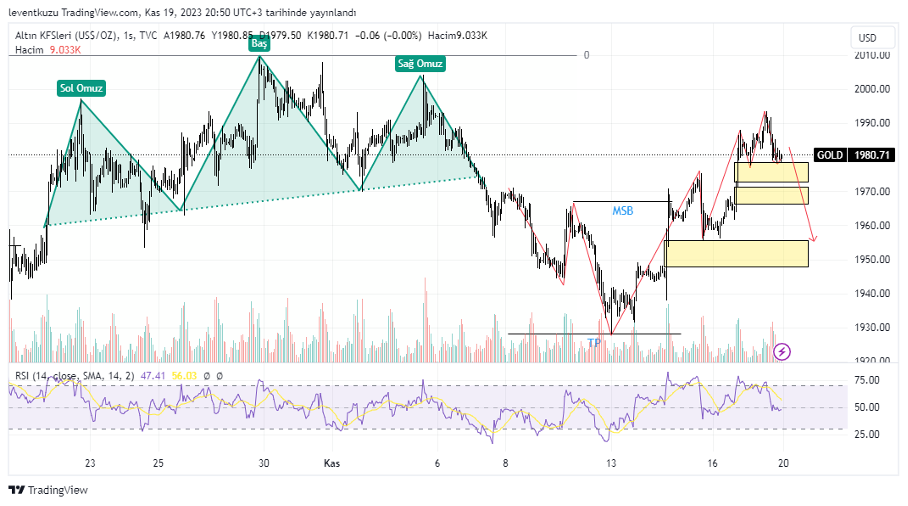
Last week, we mentioned a shoulder-head-shoulder formation and TP was flipped on 4H. We had a $1,980 price target and it was reached within the week. There are several fair value gap zones and liquidity below that can attract the price of gold. Price did not avail good entry positions for trade entries last week on short term.
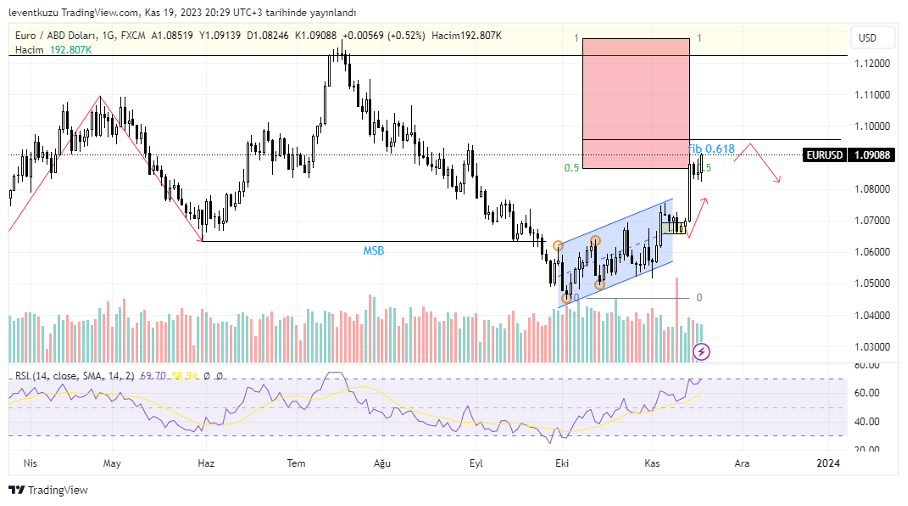
EURUSD
1D analysis
The premium zone target was reached this week. 1.086 was the critical price threshold, which is fib 0.5 of the last down leg. Now, there is a possibility to reach fib 0.618, which is located at 1.096. After reaching these values, reversal can occur, since the market structure evolved to bearish on early October. But we should have LTF confirmation since market structure can again break on bullish side. RSI on daily is in the overbought region.
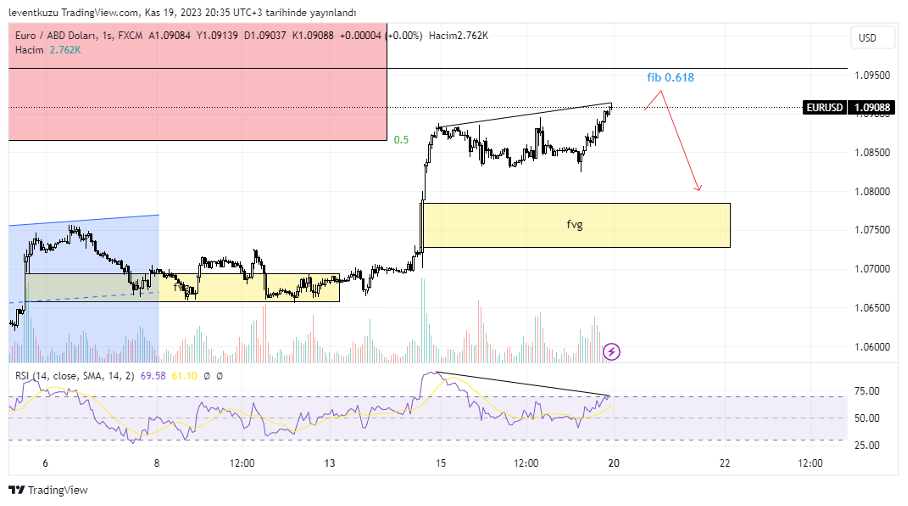
1H analysis
LTF analysis of daily HTF is done for 1H chart. We were sure that price reached a saturation zone On 1H chart there is an obvious bearish RSI divergence. Price left some fair value gap zones around 1.075 pair price. The price is expected to fill the yellow box below by whether reaching fib 0.618 or directly dropping from the current price.
** Important Note: Above ideas are not investment advice!**
Nihat Çetinkaya
https://twitter.com/nhtctnk
I’m a private trader of over 7 years, based in Istanbul.
All trading and research are my opinion, not investment advice.