BTCUSDT
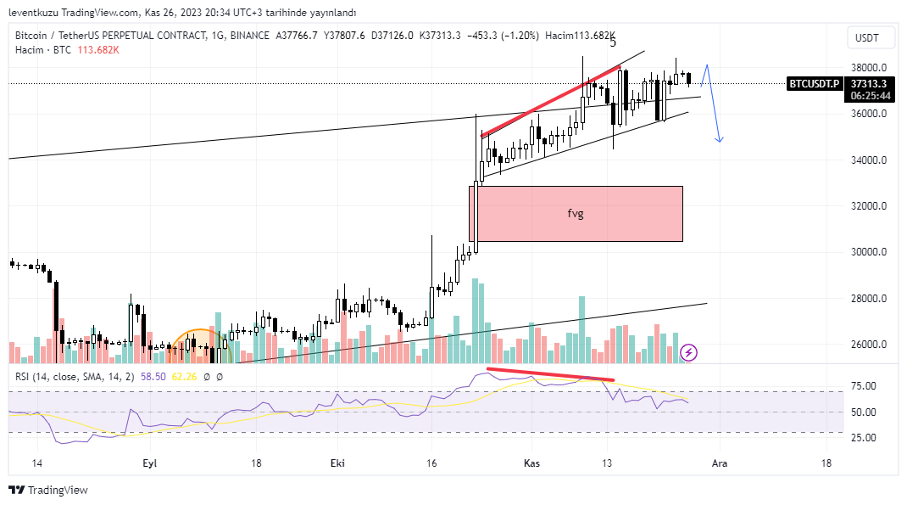
1D analysis
We were mentioning some bearish formations. At the close boundary of Wolfe pattern, which was on the weekly chart, price of BTC is rising by forming a broadening wedge. Another signal is the bearish RSI divergence, which is shown by red lines. The closest target is the fair value gap, shoen below by red color, between $30-33k.
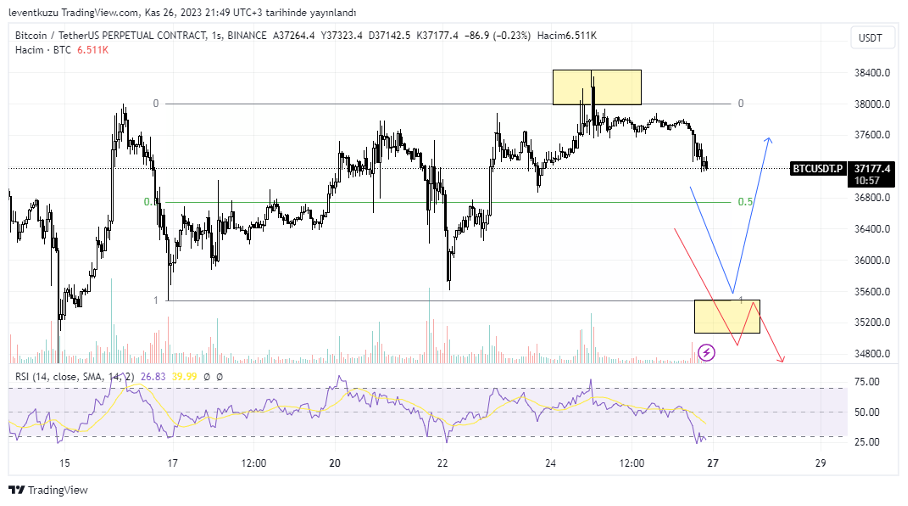
1H analysis
A new range is available on 1 H chart. It has been ten days that the price is within the last down leg, shown between fib 0 and 1. Price made a deviation at the highest boundary. The two important regions are fib 0.5 and fib 1 in the hourly chart. The probable deviation at the lower boundary is considered as a critical decision point whether price will go up again or it will retest and go lower values. We should check with lower time frame confirmations.
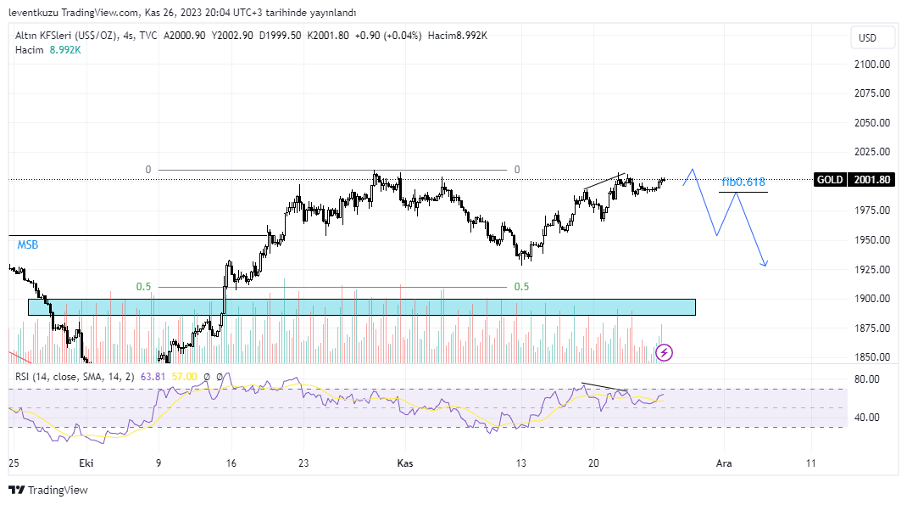
XAUUSD
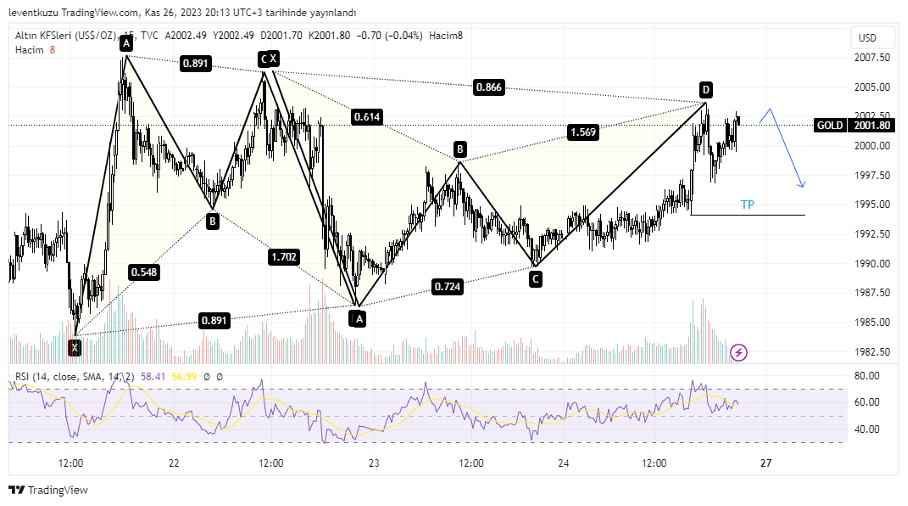
4H analysis
As the high time frame analysis, we had two different pathways last week. One was a bearish harmonic pattern, whereas the other one was bullish AB=CD. This week we have the HTF analysis for 4H chart. There is a bearish RSI divergence. We can be susceptible for a possible bearish movement. Most likely probable movement can be a 2-618 pattern. The reason is the close proximity of the current price to the last highest value seen on late November. After reaching that value and sweeping liquidity, a price path shown as the blue colours can be expected. The exact place of price reversal and entry point will depend on the first bearish wave length.
15min analysis
There were two different harmonic patterns exhibited different market conditions on 15 min chart. The first close target can be the liquidity shown in the chart. It is also a location close to fib 0.618 of the pattern. After reaching there, 2-618 commented of HTF chart can be formed. But we have to focus on the local target at first.
EURUSD
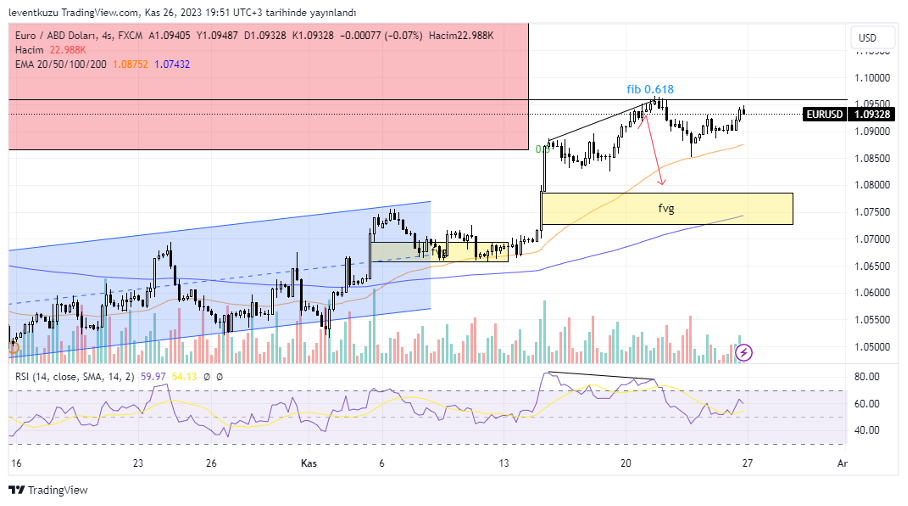
4H analysis
The HTF analysis of last week was on the daily chart. We had a target to fib 0.618 of the HTF price movement. The price reacted from the identified region. As with the daily analysis, a bearish divergence is available also on 4H chart. It seems now that the price lost its momentum. The fair value gap below can be the target. Within the gap value EMA 200 can hold the price.
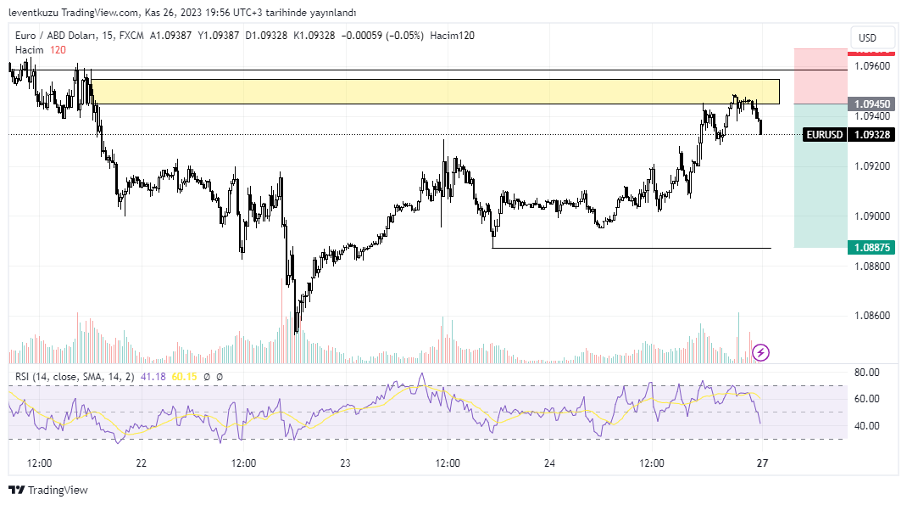
15 min analysis
On 15 minute chart, an order bock was identified, where price moved down by strong bearish candles. On the last day of the market price visited again the order block and started its bearish movement again. Short positions can be kept until the below liquidity zone. Stop level should be above the liquidity above the bearish order block.
** Important Note: Above ideas are not investment advice!**
Nihat Çetinkaya
https://twitter.com/nhtctnk
I’m a private trader of over 7 years, based in Istanbul.
All trading and research are my opinion, not investment advice.