BTCUSDT
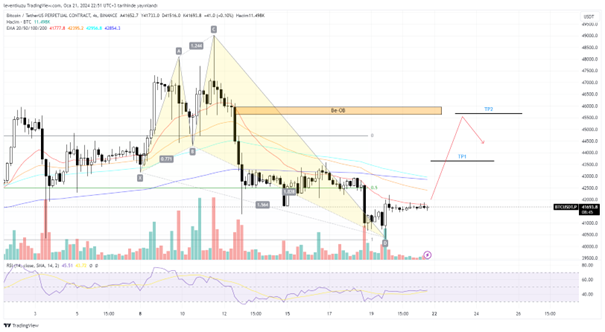
4H analysis
we have been observing a range for a long time between $44,700 and $40,300. The bullish shark pattern is still valid, since its D point is now extended until nearly 1.618. TP2 of the harmonic pattern is $45,670. This level now overlaps with the bearish order block on 15 min chart. Therefore, we may expect a rise until that level.
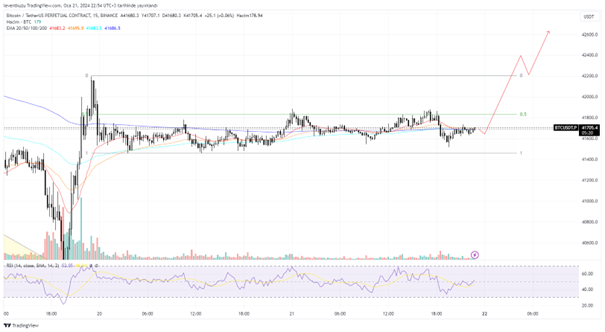
15 min analysis
After some bullish movements, price of BTC is trapped within a 0.9% gap for the last two days. After the weekly open, we may expect a break of the range. The most likely break can be upwards, since higher time frame analysis indicate higher levels. But we should always use stop loss below the deviation level of the lower boundary of the range. fib 0.5 of the range exhibited a strong resistance. Once it is broken, range high can be reached. Then after the break of range high, price can keep going higher levels by testing $42,200.
XAUUSD
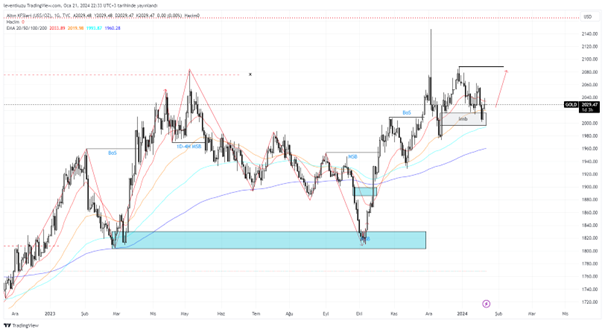
1D analysis
On the daily chart, most of the imbalance was repaired by the price. The aforementioned gap below $2,013 was somehow recovered. There is not a clear sign of bearish scenario at the moment for the daily chart. The liquidity above is still the target, which is around $2,090.
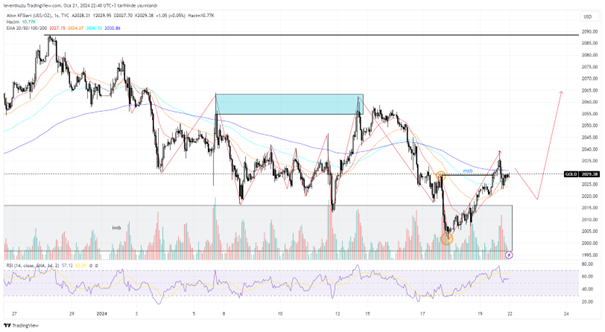
1H analysis
The box area with the turquoise colour has been an inducement zone. The box worked as an order block and price dropped within the imbalance. After that we could observe a minor market structure break. The target is still $2,090 as with the higher time frame analysis.
EURUSD
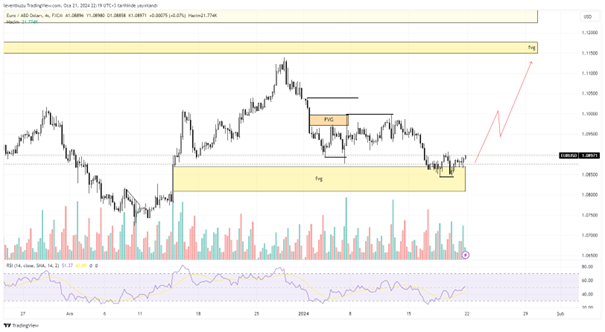
4H analysis
EURUSD pair showed well agreement with the analysis of the last week for both short term and long term analyses. Initial reaction was expected from the internal FVG. Then, a movement to the FVG below was expected. Price actually drew that pattern. Not all the gap was filled but the movement was satisfactory. A positive RSI divergence was formed. Now the current movement can occur until the FVG above. The possible pattern is shown by red colour.
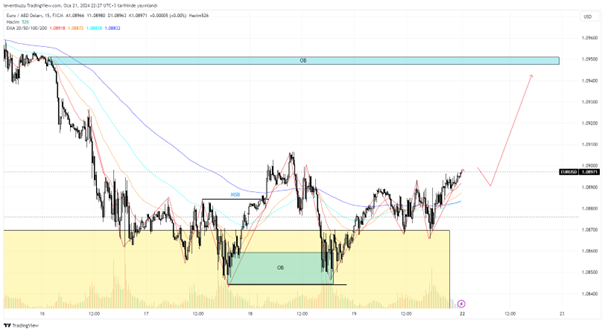
15 min analysis
On lower time frame, it is obvious that the market structure was shifted to bullish. We can observe both by the candles and EMA crossings. EMA20/50/100 are now over EMA200. On the other hand, price retested the order block which generated the market structure break. The closest target can the bearish order block, which started the downward movement. Until that pair price value, liquidity levels can be good locations for price retracements.
** Important Note: Above ideas are not investment advice!**