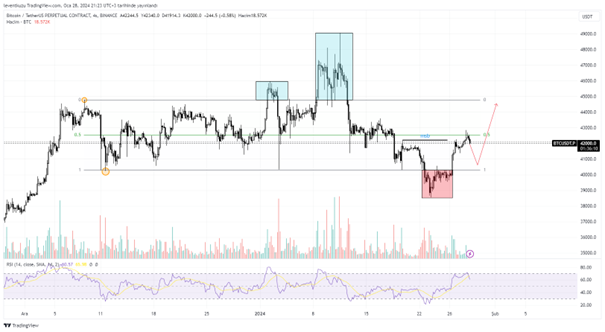
BTCUSDT
4H analysis
There is a significant range formation since the early December. The range was deviated two times on the bullish side and one time on the bearish side. In the meantime, the price is within the range and recently it got reaction from the equilibrium of the range. The equilibrium of the range is important since it shows that the range is still valid and working properly. On the other hand, there is a market structure break on 4H chart. After a pullback towards the range low, the price can target range high level. This will lead to close either fair value gaps below and top of the current price level.
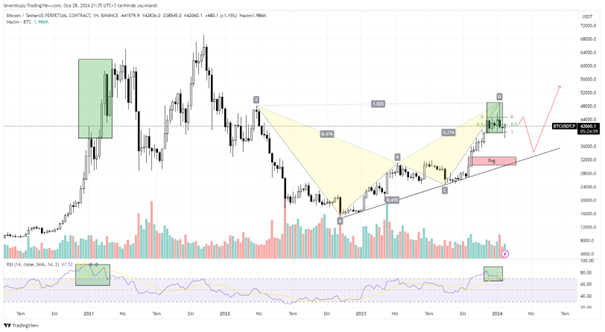
1W analysis
We have not done long term analysis for a long time. This kind of long term analysis can be useful for spot or long term traders. If we analyse RSI in conjunction with the price, after bearish RSI signals, price dropped sharply. One historic data is from 2021 with the green boxes. The other is from the current time. On late 2023, we observe the bearish RSI divergence. A HTF harmonic pattern is also formed. Actually, I would expect the price at least reach 1.13 of the X-D plane. However, on the weekly chart, it seems that just liquidity of the previous price level was taken. Considering these two factors, a pullback down to $28,000-30,000 can be expected on a higher time frame. If this happens, it will be a good entry price for long term holders since price will move from premium zone to discount zone.
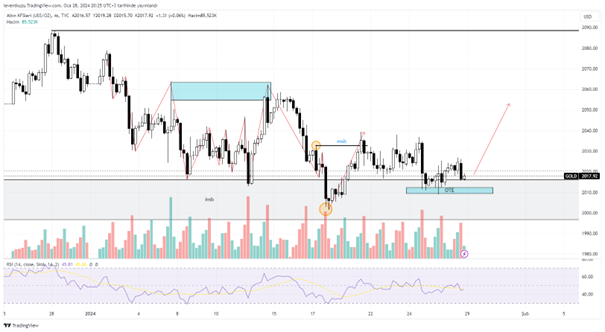
XAUUSD
4H analysis
Price reached an imbalance zone on the daily chart. on the mid-January price reached its local lowest point. A market structure break was formed on 4H chart, shown as in the figure. Price returned to the optimal trade entry location, which is between fib 0.705-0.786 of the last leg up. The reaction from the zone can be seen by the wick generated within the blue box. This was an opportunity for the traders to take long positions. As of HTF analysis, $2,100s is till the target.
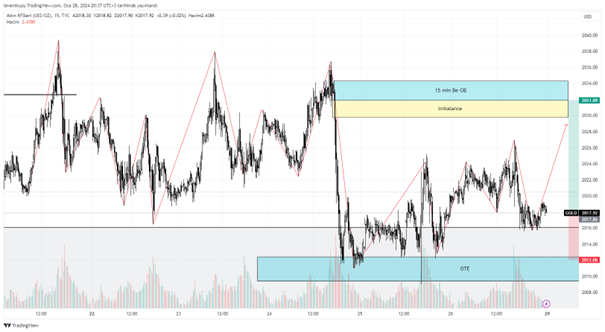
15 min analysis
On 15 minute chart, the structure of the market is bearish. Significant swing high and low points are shown by the red path. The last downward movement with remarkable volume and momentum shifted the market structure on the lower time frame. There is pretty good order block that a fair value gap follows. Such order blocks attract the candles to be reached there. On the short period, we will expect $2,030s. According to the reaction from the order block we can decide whether to go on long or close long and take short positions. On HTF analysis, we expect the market to change its direction.
EURUSD
4H analysis
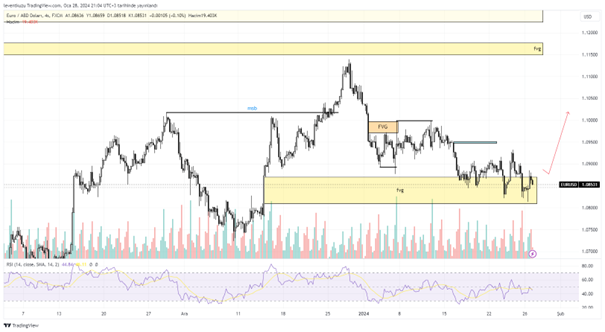
Following the market structure break on 4H chart, EURUSD pair nearly filled the entire fair value gap. Actually, we expected the bullish movement last week, however, price moved some more downwards to close the gap. As the market structure is bullish, we may expect the above fair value gap around 1.115s.
15 min analysis
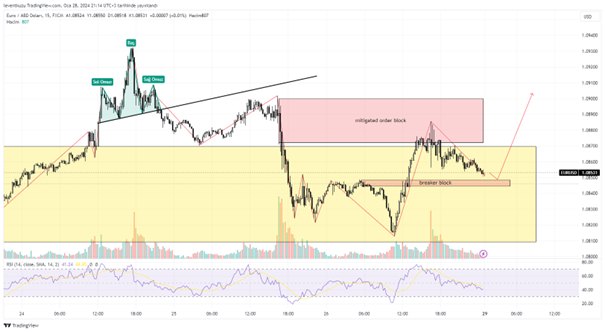
Market structure recently shifted to bullish on 15 minute chart. Some bearish formations worked well so far. They pushed the pair price downwards, which filled more gaps within the imbalance zone on HTF. After making the market structure break, price reversed from the bearish order block, which is shown by the red colour. Now, it is a mitigated block. Therefore, it is not likely to hold the price second time. We can expect the price to move in the market structure direction from the breaker block that is shown in the chart.
** Important Note: Above ideas are not investment advice!**