BTCUSDT
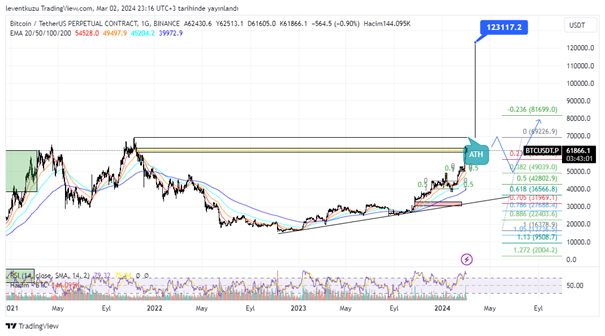
1W analysis
The price of BTC is close to all time high value. It is close to a semi-circular shape. After reaching there, we can observe a cup-handle shape. If this formation occurs, then we may expect retracement until $49.000s. After that, the price will most probable reach its new all-time high price at around $120,000.
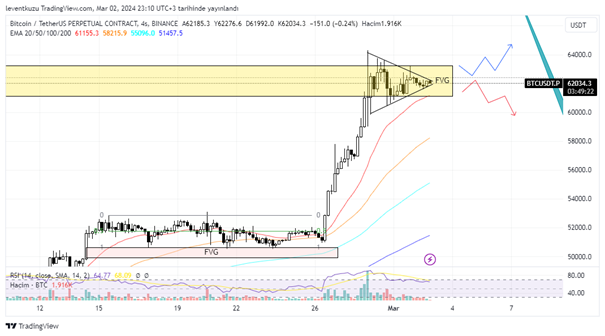
4H analysis
There was a massive increase in the price of BTC last week. After that move, the price started to consolidate. The price moved like forming a triangle. The price target of triangle is unclear. It can move in either ways. The consolidation is within an old FVG zone. Volume decrease is supporting the triangle. Now, we have to wait for the break of triangle and take the position according to the price direction. But we should not forget a possible deviation move.
XAUUSD
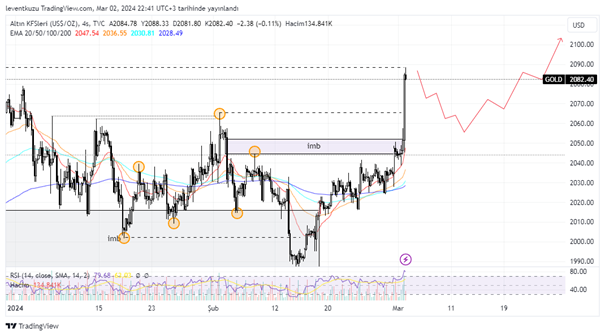
4H analysis
Gold reached its one of high values. But it was unable to sweep that price. The price increased with a high momentum. It left a fair value gap. We can focus on price increase after filling the fair value gap. In this scenario, price can drop $2,060s, then increase to move above $2,090.
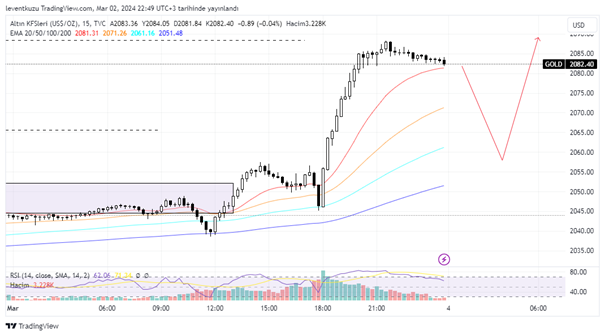
15 min analysis
15 min chart is in line with 4 H chart. Although imbalance region is not that much clear on LTF, we can see the fair value gap around $2,060s. Probably, price will retrace until EMA200, then it will continue its bullish movement.
EURUSD
4H analysis
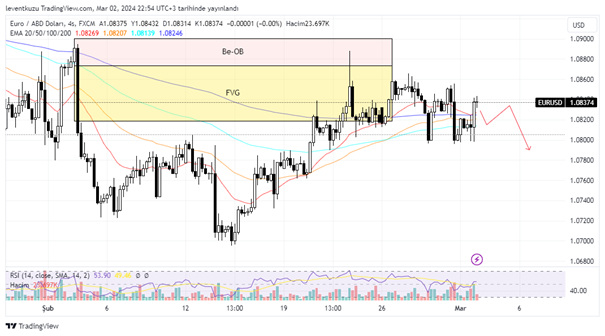
After the price reversed from bearish order block, it formed a range and moving within it. The range is between 1.08-1.086. On the other hand, LTF EMAs started to cross to the bearish side. 1.07 is the short term target on 4H chart.
15 min analysis
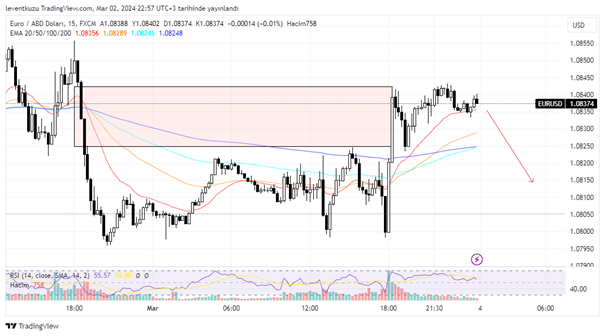
Although the price is bearish, we saw some bullish candles. Examining the 15min chart, it is clear that those candles were just to fill the fair value gap that was formed by the bearish candles. Now the price has some potential to sweep the liquidity at multiple points around 1.08.
** Important Note: Above ideas are not investment advice!**