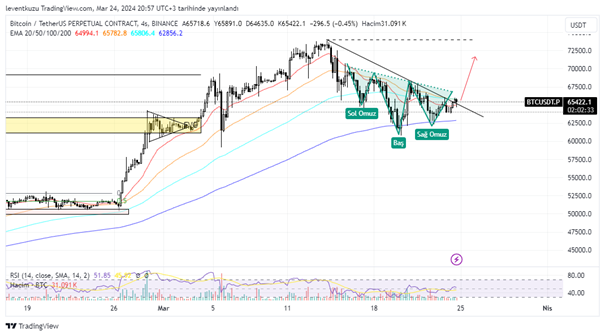
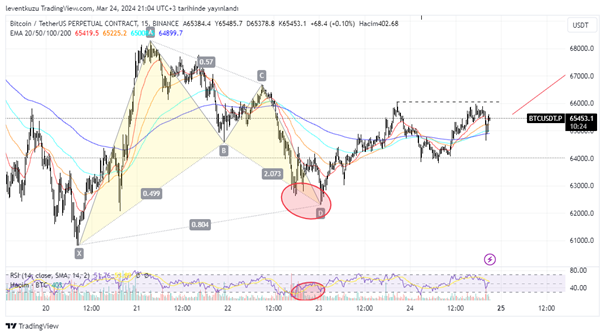
BTCUSDT
4H analysis
We can look for two different formations on 4H chart. The first is the descending trend. The line was broken to upwards and the line was retested by the last candle. On the other hand, there is an inverse head and shoulder formation. But it is not completed yet. Once it is completed, bullish entry can be considered by the break of the neckline. If it happens, the last swing high will be the target, which is shown by the dashed line.
15 min analysis
A bullish Gartley operated well after forming a bullish RSI divergence, which were shown within the red circles. The price reached fib 0.618 of D-A leg. In the current case, the price has not changed to bearish. Any candle close over the dashed line ($66,050) will be a possible indicator of a bullish continuation.
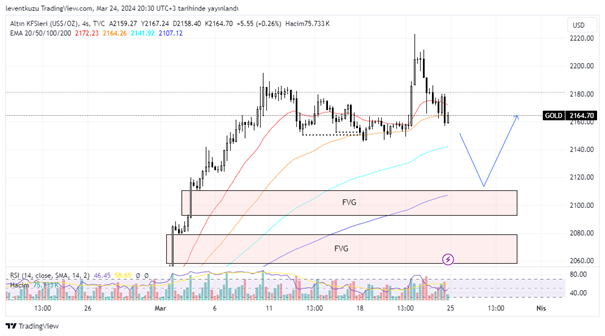
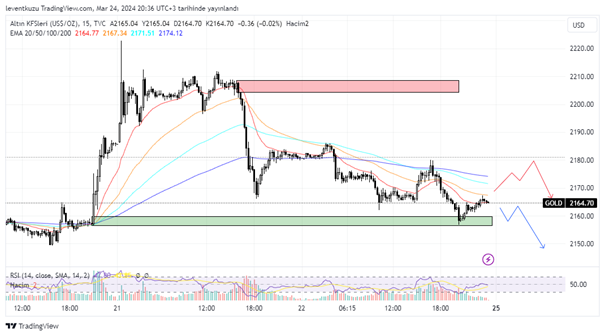
XAUUSD
4H analysis
There was two liquidities on the sell side. Our expectation was for the price to take the liquidities and move to higher values. Indeed, the liquidities were taken, which were shown as the dashed lines and then the last higher high was also exceeded. Price reached $2,220. During this movement, candles had fair value gap but they were filled. Now, there are fair value gaps below, which remain from earlier price movements. $2,110 and $2,060 are important retracement zones.
15 min analysis
Two strong price movements occurred on 15 min chart at different directions. Therefore, one bullish order block and one bearish order block was generated. Price reversed from bullish order block, however, the reaction from the block was not significant. It is most likely that the area will not hold the price if a bearish candle emerges. Although, the bearish OB is a possible reversal zone, I think the price will not reach there and will follow the blue path.
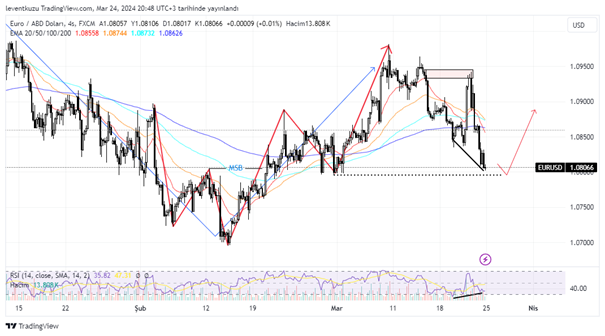
EURUSD
4H analysis
The bullish market structure of EURUSD pair has not shifted yet. We will deem the market structure bullish unless there is a candle close under the dashed line, which is the last swing low. On 15 minute chart, the bearish order block operated well, which we will discuss in the next time frame comment. But we should say for now that this OB generated a bullish RSI divergence. Price can take the liquidity over dashed line to move higher price prices. If it goes to lower levels, we will update in the next week’s comment. But the current trend and also expectation is bullish.
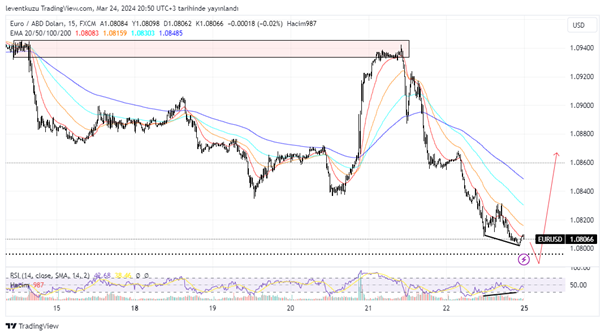
15 min analysis
The order block generated last week worked well to hold the pair price. The structure on 15 minute chart is bearish on contrary to 4H chart. As with the higher time frame chart, bullish RSI divergence exist on the current time frame. Pair price can move to higher levels possibly after taking the liquidity.
** Important Note: Above ideas are not investment advice!**