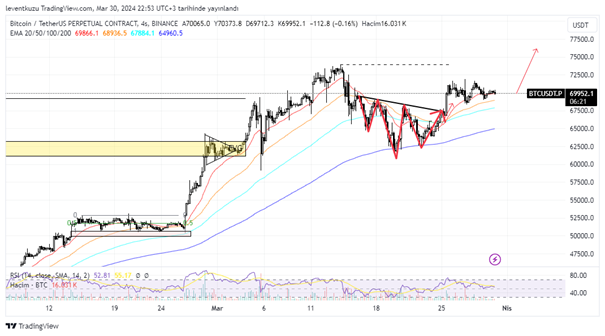
BTCUSDT
4H analysis
Head and shoulder formation was likely to be generated last week. It really did formed in the earlier days of the week. Price left the neckline with a high momentum. It generated a fair value gap. Some of it was closed. But the closest target had to be the swing high region, shown by the dashed line. Now, RSI made a correction and the price is ready to move some more higher.
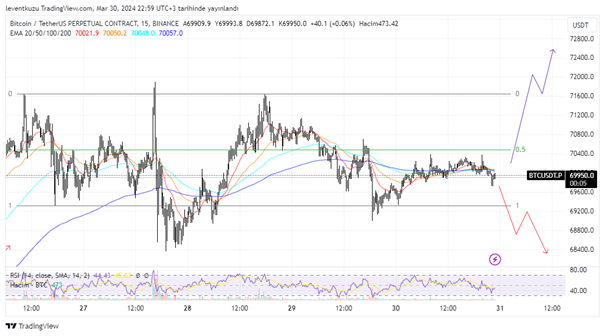
15 min analysis
After moving upwards, price remained in a range. This range is between $69,200 and $71,600. Actually, the range is not shallow. There is some room for the price to move inside. It did some deviations during this range movement. Two possibilities are available for the price movement. It will either break low or high of the range. Since higher price is expected according to higher time frame analysis, the path with blue colour is more likely to happen.
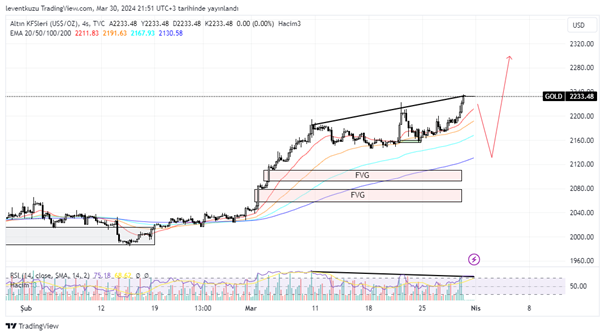
XAUUSD
4H analysis
Short-term price correction was enough to hold the price last week. After the correction, price made a new higher high. Price candles are balanced and didn’t left any imbalance recently. One-month old FVGs are still open and price is likely to hit there in due course. There is bearish RSI divergence on 4H by 2 price higher peaks and 2 RSI lower peaks. A possible pullback area still the same as with the last week. EMA200 or FVGs will be the correction target.
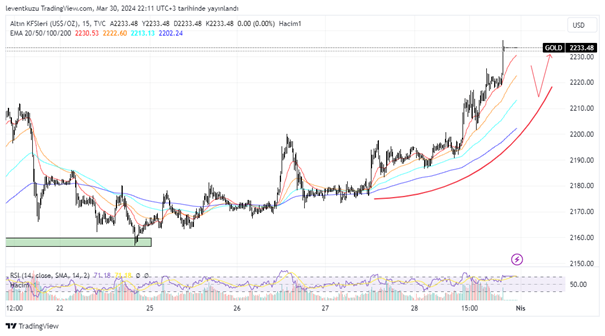
15 min analysis
The major movement on 15 min chart is by making a recent exponential movement. During this movement, the lower wicks remained opened. This can be shown by a quarter arc. It is expected that the price will remove liquidities. Lower and higher time frame charts are in accordance in terms of possible movement.
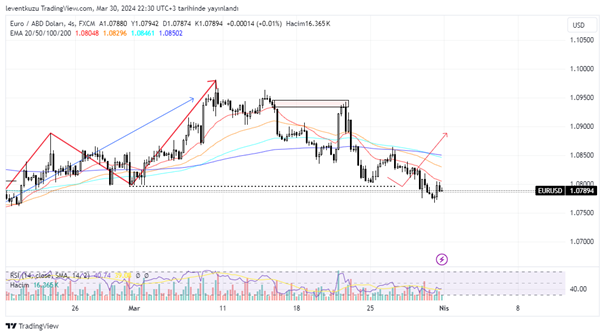
EURUSD
4H analysis
Weekly and daily market structures are bearish. The recent low was identified as a liquidity zone last week. Price did not just take the liquidity there, it also closed candle under that price. EMA 200 acted as a resistance. Price will possible try once to break that level. If it fails, a lower low can be expected.
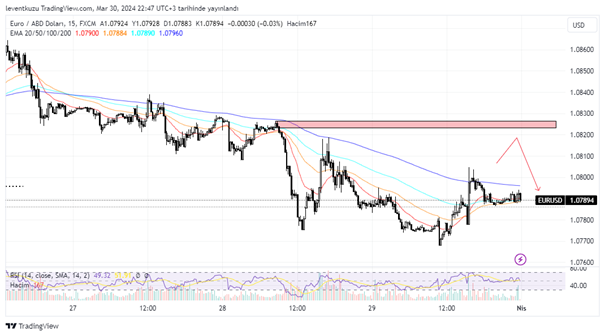
15 min analysis
The market structure of min chart is bearish. Price movements are generating lower lows and lower highs. On the other hand, price could not break EMA200. A bearish order block was generated on last Friday due to the movement by high momentum. Price can try to reach there and continue on the sell side.
** Important Note: Above ideas are not investment advice!**