BTCUSDT
4H analysis
4H analysis of the last week is still valid. Reverse head and shoulder formation was in play and neckline break was formed by a strong candle. Then, neckline was retested. After that, price reached to $70k. The target of the current formation is $74k, which is the previous high value, shown with the dashed line. In case it happens with a wick, we may expect a correction in the price of BTC.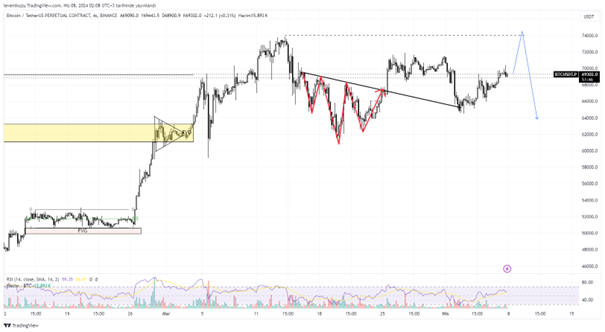
15 min analysis
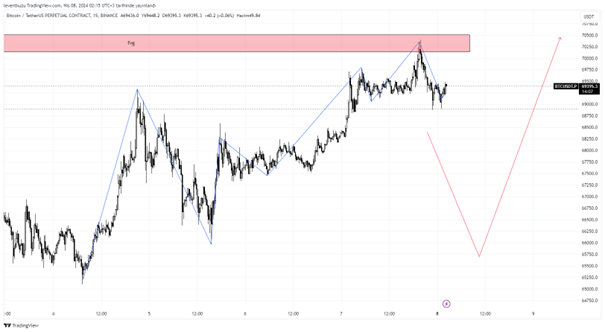
The market structure on 15 minute chart is bullish. Possible reversal may occur. In this case, the liquidity at $66k may be the extreme target. The price reached a former fair value gap zone. On the other hand, price formed a bearish harmonic pattern. Taking into account all these, we may expect a pullback before moving higher levels.
XAUUSD
4H analysis
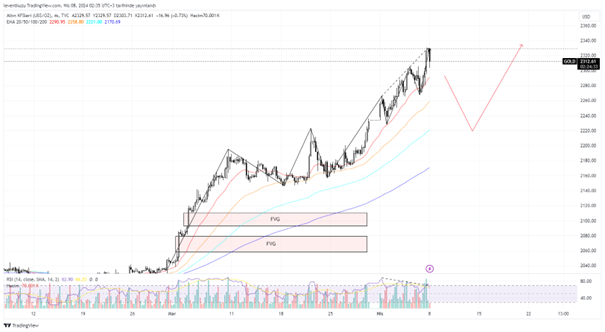
price of the gold is increasing without any significant correction. The most obvious formation is the occurrence of bearish RSI divergence, which is shown by the dashed line. This will possible occur until fib 0.618 of the last impulsive price movement. If it happens, EMA100 will be a critical price zone for a possible reversal.
15 min analysis
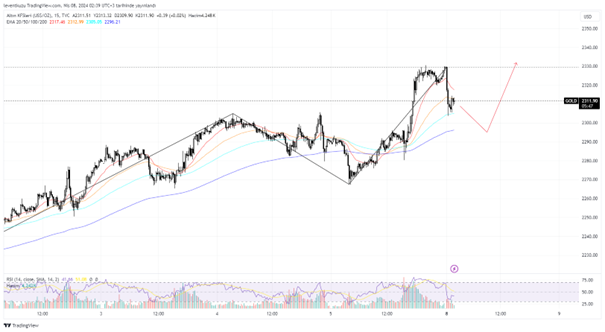
As with other higher time frames, bullish market structure exist for 15 minute chart. Impulsive fair value gaps were filled with impulsive bearish candles. Current RSI and EMA patterns show that EMA200 will be a strong barrier for the price as a support level. That level can be used for building long positions.
EURUSD
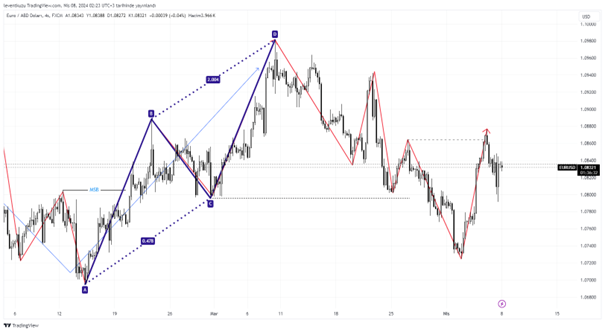
4Hanalysis
The bullish market structure of EURUSD pair seems to be broken bearish according to change of character structures. But an AB=CD is available on higher time frame. The downward price movement seems to retrace until fib 0.886 of AB=CD pattern. The change of characters remained as an inducement for now. If price 1.07 is lost, then we can talk about bearish market structure break. Now there is a little bullish change of character. Current target is at least 1.094 pair price.
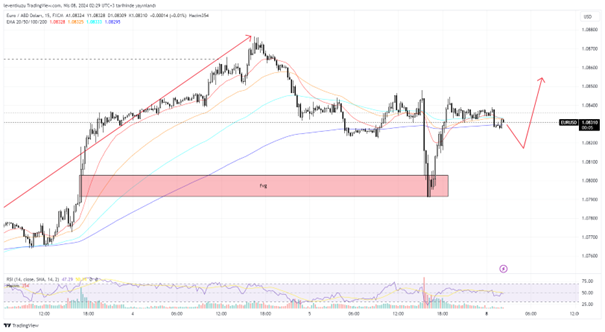
15 min analysis
EMA 200 holds the price well. It was lost once. That time, price filled a fair value gap. This was an extraordinary movement for sure. But technically, the sharp movement makes sense. Now we can expect values over EMA200 and most likely the prices over the last swing high price.
** Important Note: Above ideas are not investment advice! **