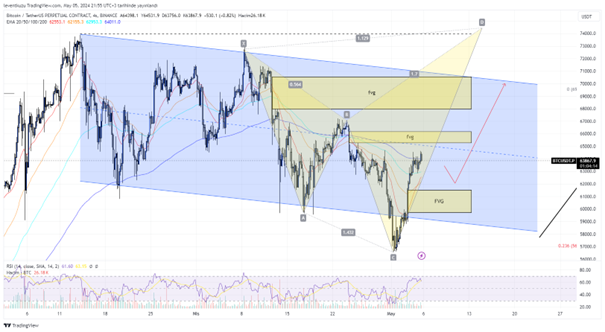
BTCUSDT
4H analysis
Price of BTC is within a descending channel since the last three weeks. Price moved under the channel-low level but then re-entered it. During these movements three clear fair value gaps were formed. One of them is below the current price. Considering the saturated nature of RSI and proximity to the current price level. $60-61k would be a perfect price for setting up long positions. The most likely pattern is a bearish shark. fibonacci level of D point can be between 0.886 and 1.13. For me, fib 1.13 is significant since it will fill two remaining buy side FVGs and tap to ATH level. After reaching ATH, a price drop until the midst of the descending channel is possible. I expect a price increase but not a rally at the moment. Since these are projections, we will update them on the upcoming weeks.
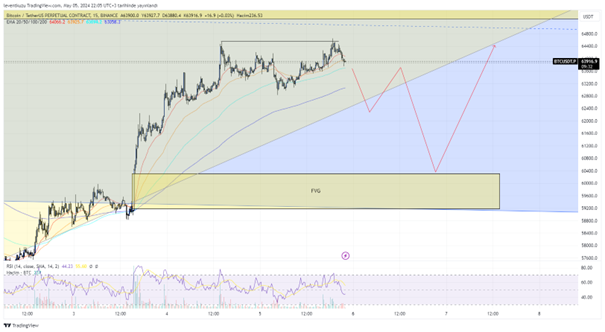
15 min analysis
Looking at the current chart on 15 min, we can see a price increase and a decrease on RSI. Actually, this is a bearish sign, however, price moved to higher values. This is a typical bullish pattern for BTC. RSI divergence on 15 min usually does not operate well on BTC chart. There was a steady increase on the price and EMA200 was also increasing like a trend line. Price is within a range for one day. It took liquidity on the buy side. A price decrease may now happen to the fair value gap below. After that price can keep its bullish structure. The market structure will not shift to bearish until $59,5k.
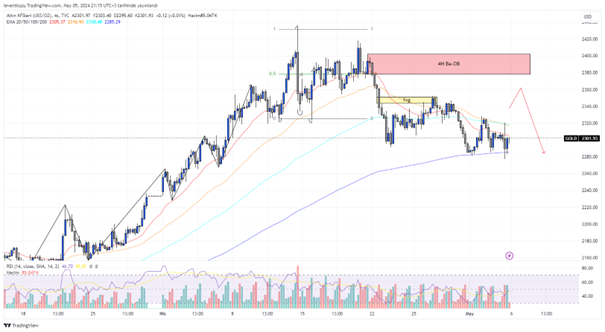
XAUUSD
4H analysis
After the loss of the range at the top, market structure shifted to bearish by strong bearish candles. The first target was the fair value gap. It was reached by the price but it was unable to move further. The next target would be the unmitigated order block, shown by the red colour. We will leave it as a point of interest for now. After filling the FVG, short term EMAs also turned to bearish. The significant fair value gaps lay around $2,100. Although 9% of drop is required for that zone, it can be possible by some news.
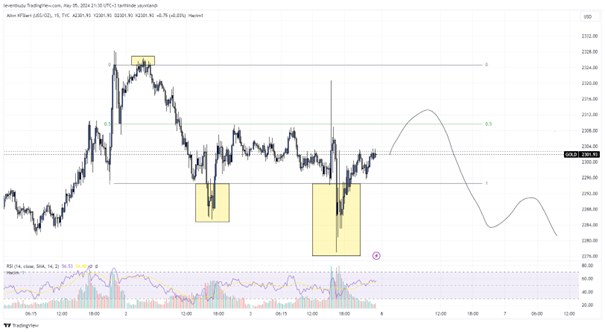
15 min analysis
Price lost the bullish movement on higher time frame. Now there is an unclear situation on 15 minute chart. This cases can be considered as range zones since there is not a clear structure to either sides. The range was deviated several times and range-mid level worked well to hold the price. Price is likely to lose the range low on sell side after reacting from range-mid or range-high levels. After going down to range low, a retest to the same price will be a confirmation of a bearish movement.
EURUSD
4H analysis
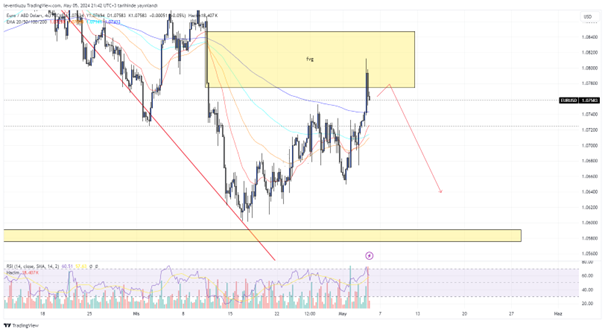
Previously depicted fair value gap was partially filled by the price movement of the EURUSD pair price. EMAs were crossed over and the RSI is saturated. There will not be enough room for a higher pair price. The price will keep its bearish movement. The most likely target is the 4H fair value gap below around 1.058.
15 min analysis
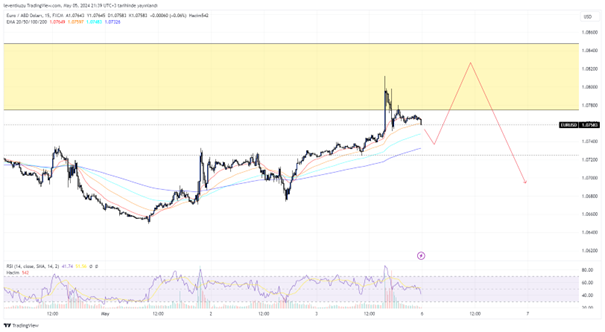
The pair made the expected move and filled some of the gap. The chart is bullish on 15 minute chart. It is possible to make a retracement on EMA 200 and then make one more impulse to fill some more gap on the imbalance. After that we may expect a bearish market structure break and the targets will be the swing points on the chart between 1.066 and 1.067.
** Important Note: Above ideas are not investment advice!**