BTCUSDT
4H analysis
The descending channel is still in play although there is a price rise of BTC. Now, the price is around the D point of a harmonic pattern. Here, there are some weaknesses. RSI lost its momentum although price increased some more. Also, volume bars have less intensity. Possible reversal will be until $63k to fill the fair value gap and move to retracement zone of the minor harmonic pattern. After that, ATH level will probably be the target.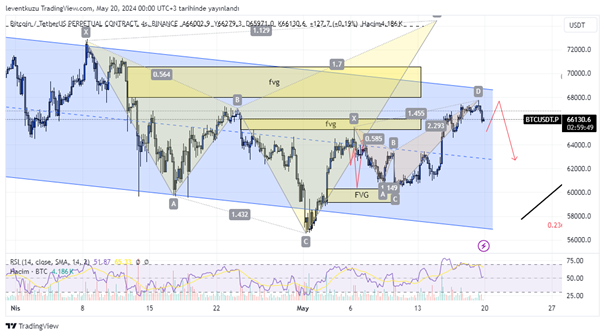
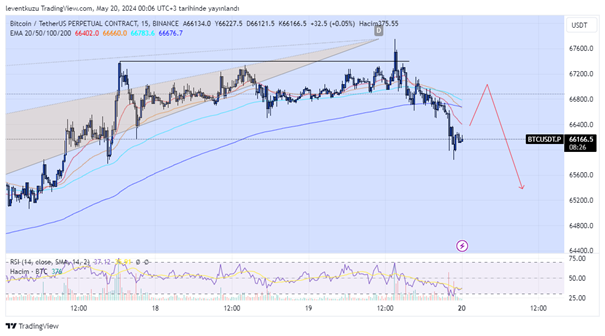
15 min analysis
There is a clear trend change on 15 min chart. EMA200 were crossed by lower time frame EMAs. Also liquidity was removed by reaching over $67.5k. All conditions are suitable for a small loss of value of BTC. It will be convenient to take short positions when RSI rises above 50 value.
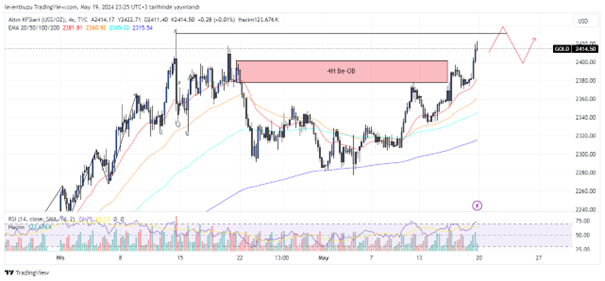
XAUUSD
4H analysis
The order block with red colour was reached once and there was a reaction there. Then, EMA50 held the price and it retried to break the order block. In the second and third attempt, price went beyond the order block and the zone is now invalidated. In the current outlook the liquidity around $2,430 is the nearest attraction point. The structure is still bullish.
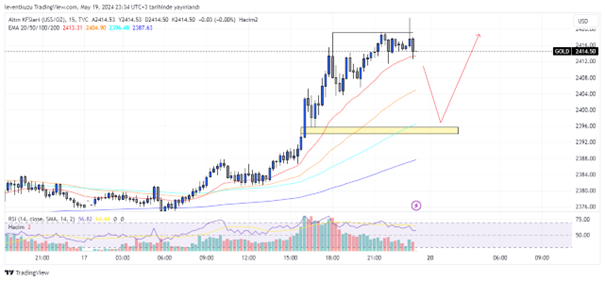
15 min analysis
As with 4H timeframe analysis, the market structure is bullish on 15 min chart. But we observe two different weaknesses on the chart. Although price is increasing, RSI is losing its momentum. Additionally, volume bars are shrinking. Both indicate that price will reverse from a close price level. Also we may think that price removed one liquidity and will move below. The closest point of interest is the fair value gap below, show by yellow colour.
EURUSD
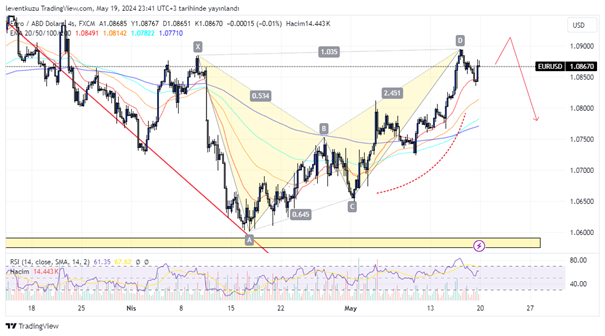
4H analysis
The order block shown last week was deviated and price went some more up to remove the liquidity. Now, there are open liquidities below. Price may target these levels. The entry should be based upon short time frame confirmation.
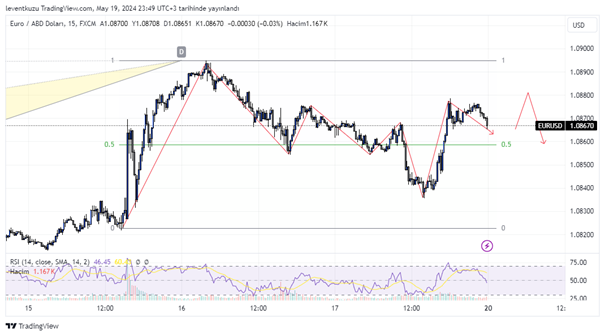
15 min analysis
A typical range-like structure was formed at the current price level. Equilibrium of the range did not work as a single line. Instead it worked as an area. There is not a clear break of structure. Range high can work as a resistance and price can move to lower prices as expected from higher time frame chart. But before moving to lower prices, a deviation of the range is also possible until fib 1.13 of the X-D leg of the harmonic pattern on 4H chart.
** Important Note: Above ideas are not investment advice!**