BTCUSDT
4H analysis
On a lower time frame chart, the first FVG at top had some potential to carry the price a bit higher until $69.5k. However, it was not strong and there is still no strength indicator. Blue curve of stoch RSI is about to cross orange one. This can cause a price drop until $63-65k range. This will sweep the fair value gap and reach the target of previously drawn bearish shark pattern.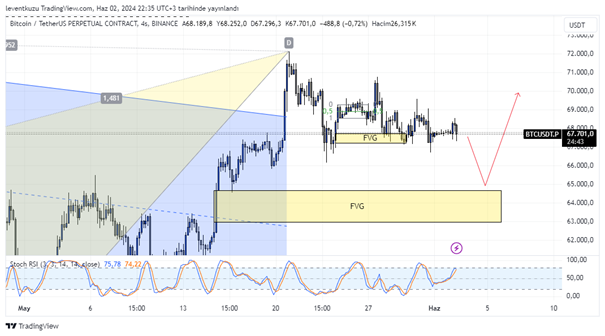
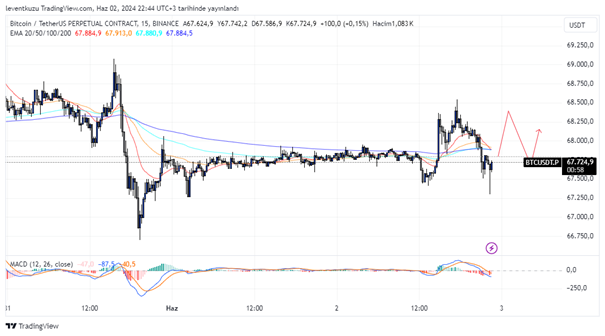
15 min analysis
Although there is a recent fluctuation in the price, the price is around $67,7k. There is not a clear trend in the current time frame. It is possible that a side way movement is possible on BTC price. The price then can want to fill the FVG below on the HTF chart. At the end, ATH will be the target.
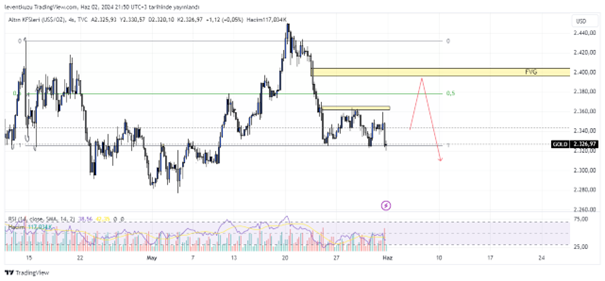
XAUUSD
4H analysis
The price of gold still remains within the drawn range. Last week’s 15 min harmonic pattern worked well and the little yellow box did not permit the price to move upper levels. The actual target was the fair value gap above the equilibrium of the range. However, it reached the range low again. Now the price can try the FVG once more and can go down of the range low line.
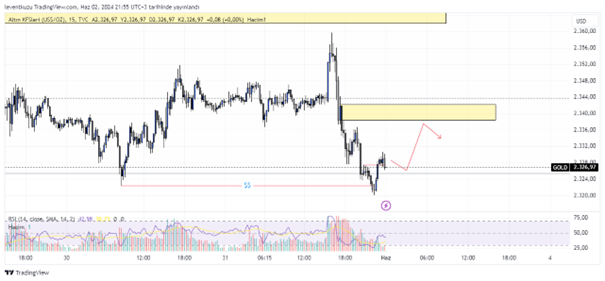
15 min analysis
According to lower time frame chart, the price swept liquidity. There is a minor break of structure, which is, for me, not quite reliable. Vast majority of the FVGs were removed during the down trend. Only a small gap is available around $2,350. The drawn point of interest will be the target after a probable pull back to range low line.
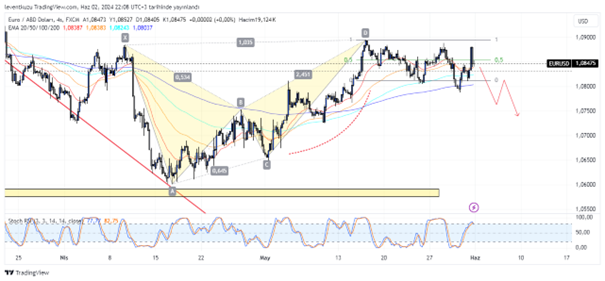
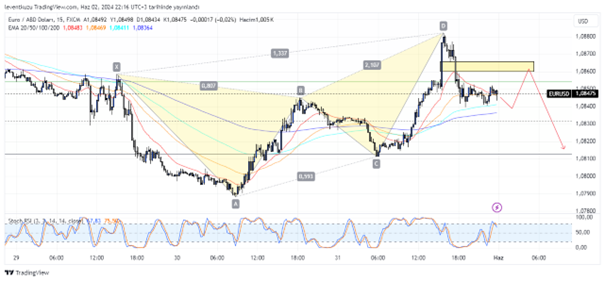
EURUSD
4H analysis
After the formation of bearish harmonic pattern, price of EURUSD has an extended range. Previously, EMA200 held the price but stochastic RSI was at a low point. Now that indicator is around 70 and short term signal crossed long term signal to lower. This exhibits a potential for a lower price movement. Upon the break of EMA200, the price will sweep the liquidities.
15 min analysis
Considering the indicators, the possible price path is shown as the red line. The opposite FVGs created a point of interest for the price. But according to stochastic RSI, price can go down to EMA200 level. After that, POI can be tested. Then the ultimate target for 15 minute chart will be 1.081 level.
** Important Note: Above ideas are not investment advice!**