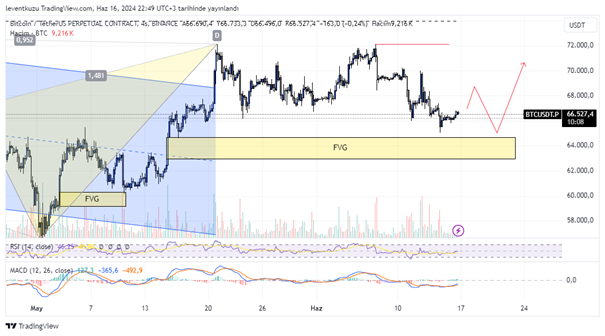
BTCUSDT
4H analysis
The price moved according to our expectation and moved close to the fair value gap. Currently, price didn’t tap the imbalance. Usually, 4H RSI divergences are strong and there is a bullish RSI divergence on the current chart. Price will move somewhat high, after that, I expect it to reach FVG. This zone is a good place to build long positions. After that, price will target ATH level.
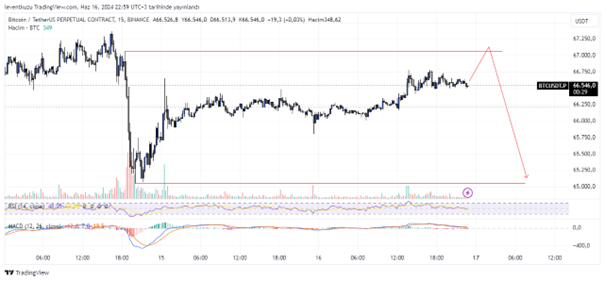
15 min analysis
There are two liquidities on the chart, one on the sell-side, one on the buy-side. The closest liquidity is the most probable location for the price to be reached. After sweeping the liquidity, the lowest liquidity is the likely target.
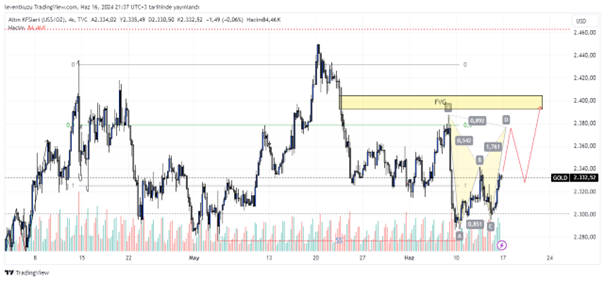
XAUUSD
4H analysis
Price of gold manipulated the range low and now again within the range. Current state indicates that a bearish harmonic pattern can form. Its target is the equilibrium of the range. That’s why I find a high probability of the formation. Then, price will make a correction. After that, the fair value gap shown with yellow box will be the target.
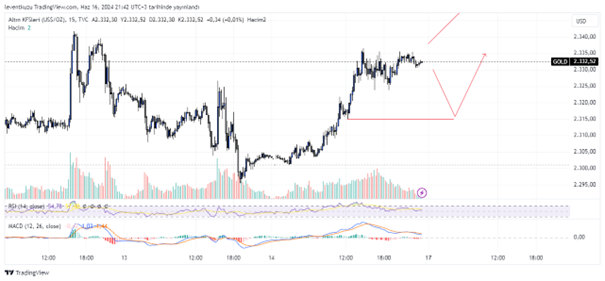
15 min analysis
In the lower time frame, the price is fluctuating within a narrow price span. The momentum drop is obvious through RSI. Below liquidity points will be target. I think, the most extreme target will be $2,315. After sweeping the liquidity, the price will move higher to the 4H target.
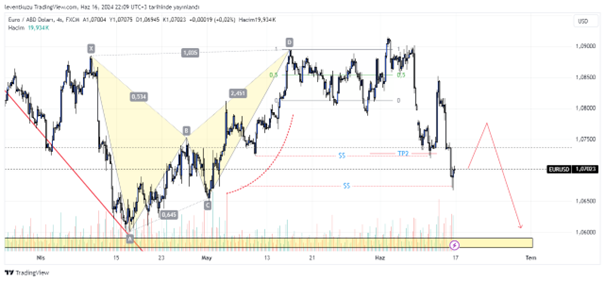
EURUSD
4H analysis
Finally, long waited targets were reached. TP2 of the harmonic pattern was reached and below liquidities were swept. While reaching these levels, many more fair value gaps were generated. Price has the possibility to rise between 1.08 and 1.075. After reaching there, the probable target will be the FVG below 1.06.
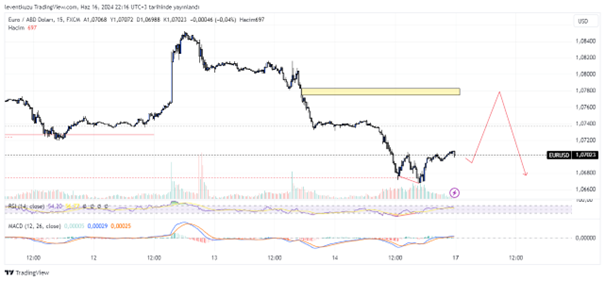
15 min analysis
Target of the last week was reached and moved some more below. As going below the expected price, a bullish divergence was formed. The probable target is the fair value gap above. After reaching there, lower targets according to HTF chart will be activated.
** Important Note: Above ideas are not investment advice!**