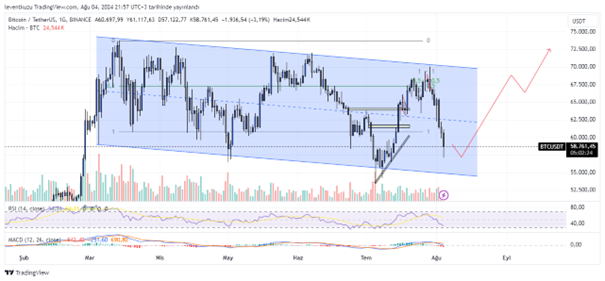
BTCUSDT
1D analysis
The analysis of last week showed us a possible drop of BTC price. The descending channel movement is still in play. Current price levels are a possible reversal zone. Sooner or later, descending channels produce a bullish movement. To start such a bullish movement, price must first break the channel over $70k. After that level, higher prices can be expected. We will update chart according to price path. In the current case, both RSI and MACD are close to oversold area.
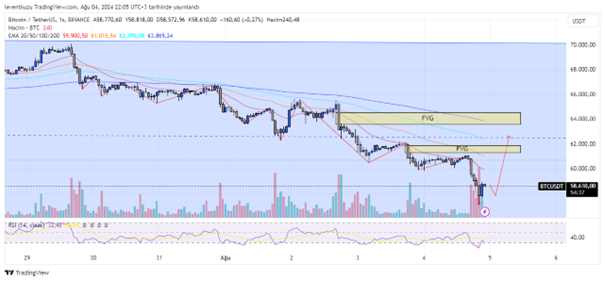
1H analysis
Price is making regularly lower lows and lower highs since the last week. There was a false signal that can be regarded as a MSB but it did not cross EMA200. Price continued to push lower levels. Now, we can observe two significant FVGs on 1H chart. One of them is around $61.5k and the other one is around $64k. Considering the distance from EMA levels and the current state of RSI, we can expect a rise in the price until FVG zones.
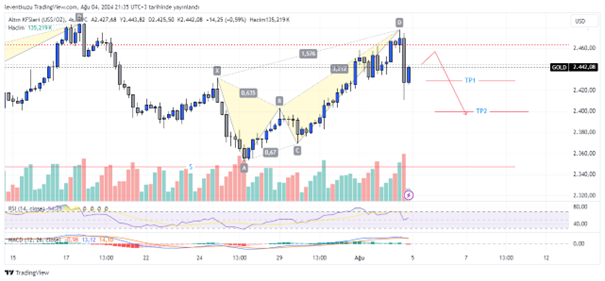
XAUUSD
4H analysis
Considering the analysis of the last week, the price path worked well and we are on the onset of a new week. Recently, a bearish crab formation was formed. There is a bearish RSI divergence and the price dropped sharply. This sharp bearish candle generated a fair value gap. Price can go up to fill the gap and move until take profit 2 (TP2) point, where is the fib 0.618 of the harmonic formation.
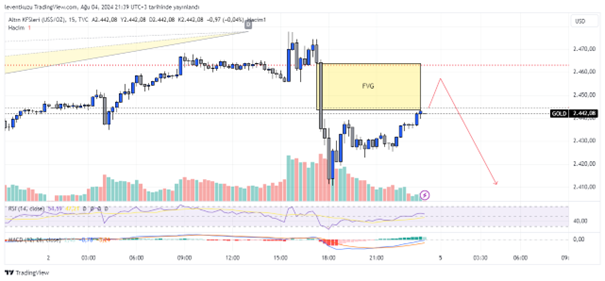
15 min analysis
Short term analysis of gold is quite similar to that of higher time frame. The formed fair value gap is visible in the current chart. Price will probably fill some or all of the gap and then move to lower values.
EURUSD
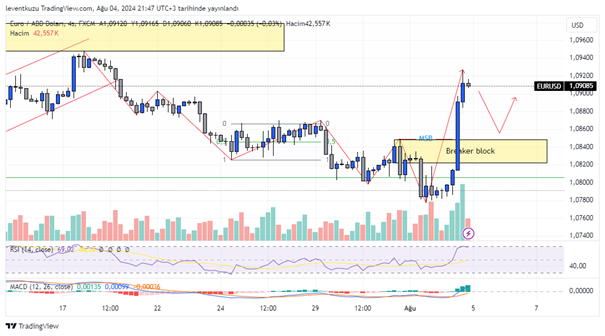
4H analysis
The pair price of EURUSD was within the range drawn on the chart last week. Our expectation was a bullish movement either from equilibrium or range low. Price reached range low and exhibited a manipulation. Then, bullish movement occurred and price went up by a candle with FVG. RSI is in the overbought region. Price can return to breaker block, which is just under market structure break line.
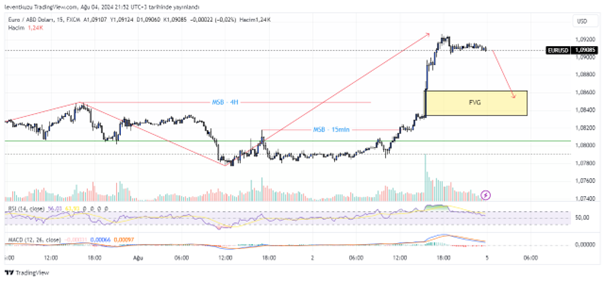
15 min analysis
Market structure break line of 15 min chart is a bit different from 4H chart. After market structure break of the 15 min chart, imbalance was generated. RSI and MACD indicators are indicating a probable decrease of the price. 15 min FVG will possibly be filled. This is the area, which was shown above as the breaker block zone in 4H chart.
** Important Note: Above ideas are not investment advice!**