BTCUSDT
4H analysis
The expected price lose down to the below FVG was partly realized last week. The price returned from $56.1k. Recently, the price hit another fvg around $60.5k. The most likely attraction zone will probably be the liquidity pool above around $62k. This location can be a scalp short position. For any swing position, we have to observe the behaviour of the price according to price reactions on the price range.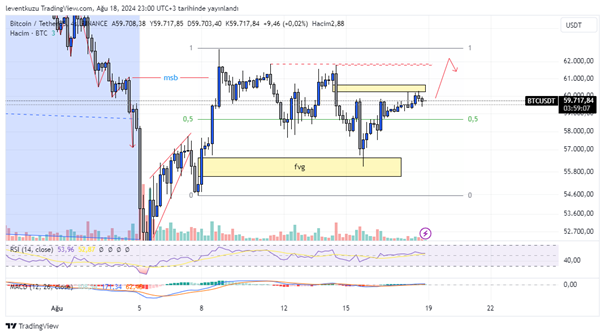
15 min analysis
As being on the weekend, we cannot observe serious price movements on BTC. The trading volume shrinks during the weekend and therefore, it is not easy to determine the bias for 15 min. The current price can be shown as a range movement. Since for low trading volumes, it is the best scheme for determining a bias. As $62k is a possible target for 4H chart, I would like to draw attention to bull biased range movements. The validity of the current range can be checked by the reactions from equilibrium. This zone reacted well to the price candles. Two bull positions are shown on the chart by blue and red colours. According to current state of MACD, the red path can be valid.

XAUUSD
4H analysis
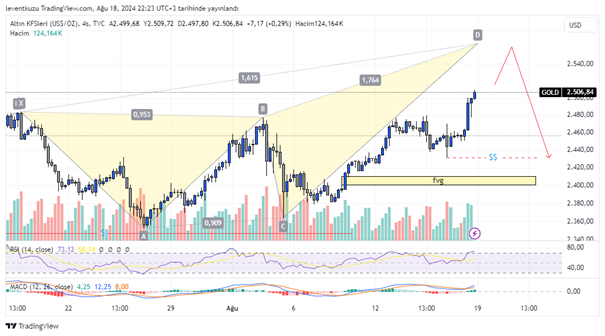
According to short term analysis of the last week, we mentioned an upward channel movement of the price. If the channel was broken, we would take short positions. However, it was not broken below. If it was the case, the target would be the FVG zone. Now, there is a bearish deep crab, which is likely to be formed. D point should be at 1.618 of x-A leg. Once the formation is valid, the price can return from $2550 until the liquidity below around $2430. It also corresponds to fib 0.618 of the harmonic pattern.
15 min analysis
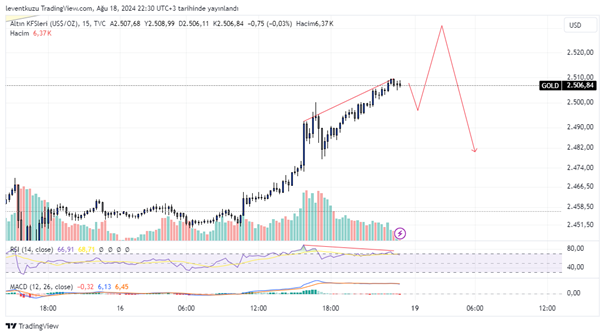
The price is pushing upwards, however, there is a clear loss in the momentum according to RSI. It is also obvious from bearish RSI divergence. A mitigation of direct market structure break will occur. According to the type of the break, a mitigation block or a breaker block can be regarded as a good entry location for a short position.
EURUSD
1D analysis
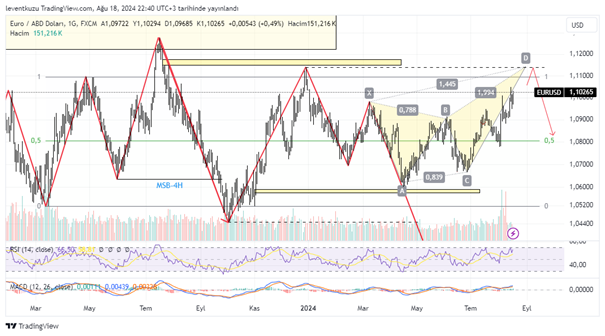
On the daily chart, the market structure was broken on the bearish side last October. Also, a range is available on the chart. On the daily, the candle close should be over 1.125 so that we can assume the bearish structure is invalid. The price is close to generate a bearish butterfly formation. D point should be either on 1.27, 1.41, or 1.618 of X-A leg. According to least point, the return would be just below the range high level. If the extreme point is the target, the liquidity shown the dashed line will be swept. The target will be the equilibrium of the range, which is around 1.08.
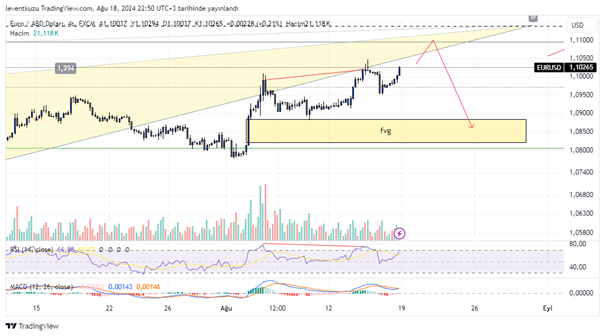
4H analysis
Although the price is pushing upwards, RSI is losing momentum. Bearish RSI divergence can be observed from the red lines. In the current situation, MACD is about to cross to the green zone. A continuation of the increase can be still observed. The price will then return, make a market structure break and will target the FVG below.
** Important Note: Above ideas are not investment advice!**