BTCUSDT
4H analysis
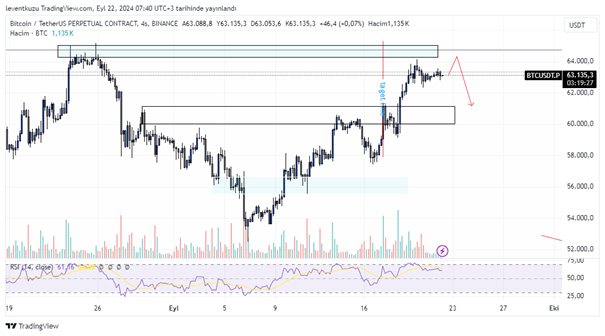
The target for the chart of last week was almost met. The available formation was an inverse head and shoulder pattern. The target is above the blue zone. However, this area worked as a resistance several times previously. Therefore, it would not be easy for the price to go beyond this area. Actually, the price have not tipped the area yet. A wick can manipulate the area, then price can retrace back to neckline zone around $60k.
15 min analysis
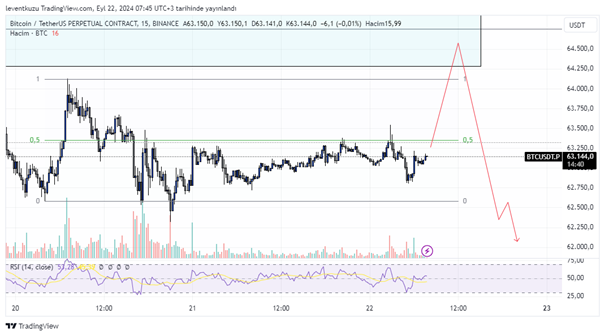
The price is within a range on 15 minute chart. A deviation occurred though sell-side boundary of the range. A buy-side deviation is probable. Once this happens, the resistance area will be visited. This area will be a possible barrier and price will want to move towards first range-mid and then range-low levels. The loss of range and retracement will show us the possible price directions.
XAUUSD
1D analysis
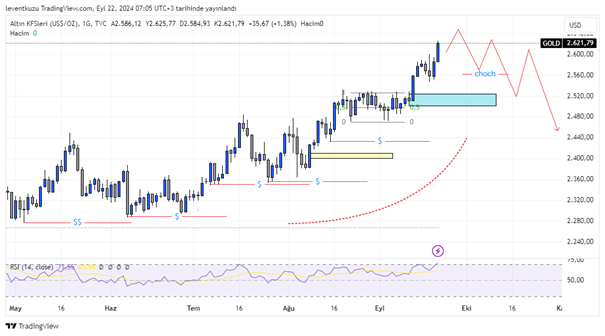
The price of gold is increasing by leaving open liquidities. Only a minority of the liquidities were taken. The pool of liquidity is available roughly between $2280 and $2480. After the break of the range, which is better visible on 4H chart, the price is still keeping its bullish movement. The order block which is shown by blue colour is still valid for a retracement. A character change in the market structure is mandatory in order to reach the target. The region will probably act as a reaction area, which will provide a strong candle. If the bullish movement is lost through the order block, then the liquidity pool will be the target.
1H analysis
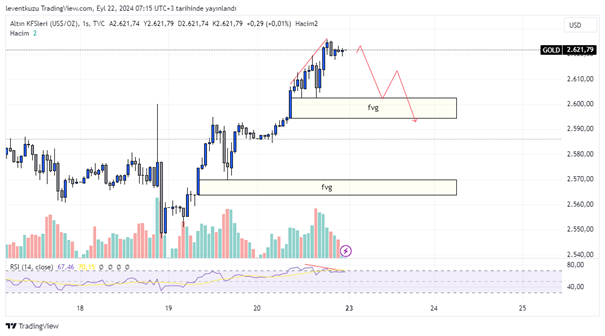
The price started to exhibit weakness through the bearish RSI divergence on 1H chart. Current structure of the market is bullish. The price just took liquidity from a candle. The price can increase until there is not a significant change in the market structure. Once an MSB is formed, the price can move as shown. FVG zones are possible point of interests.
EURUSD
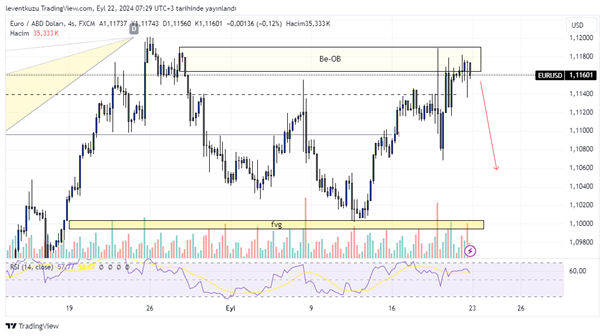
4H analysis
HTF harmonic chart is still valid for EURUSD pair. Price revisited the bearish order block at top. The order block was almost entirely filled by a single candle and after that a sell-side liquidity was taken. These series of candles shows the manipulation in the market. In order to be informed for such price movements, market open sessions should be observed. The price cannot move through the order block. The price will probably reverse from the current zone.
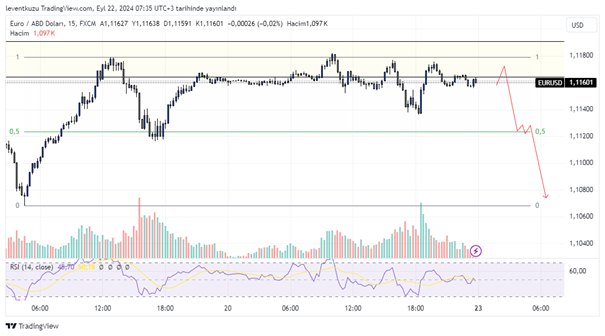
15 min analysis
There is a range on 15 minute chart. The last upward leg produced a range. The price candles reacted from the equilibrium of the range and produced a small deviation. After the loss of order block, the probable targets will be range-mid and range-low levels.
** Important Note: Above ideas are not investment advice!**