BTCUSDT
4H analysis
We caught the bearish movement. It was not effective at all, until the FVG around $63-64k. Now the first point of interest is the fair value gap above the price, which lasts at the horizontal red line. The price can increase up to $70.6k. Then, one more reversal is probable. The drawn FVG will be important in this case. Because it is also the target for the bearish shark pattern. Even if the price reaches there or not, the mid-term target will be the liquidity at ATH, which is shown by the dashed line. 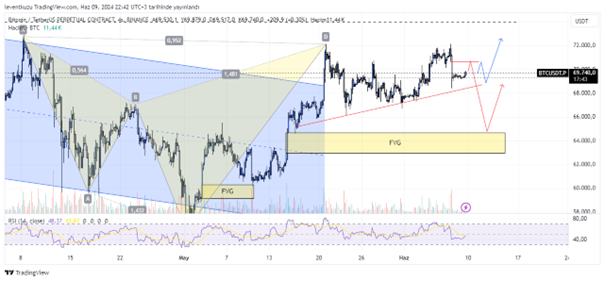
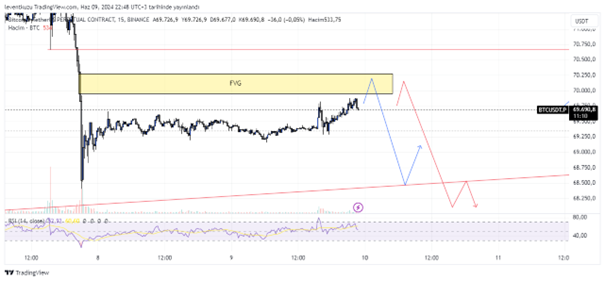
15 min analysis
On 4H chart, the top of FVG was the red horizontal line. But the refined FVG for 15 min chart is shown by the yellow box. The increase in the volume is promissing but bearish RSI divergence is not the thing we would like to see in an incresing price. After the price reaches the FVG, it will possible reverse to downside. The liquidity below will be the first target. We will decide for further price movements according to the reaction from the red line below.
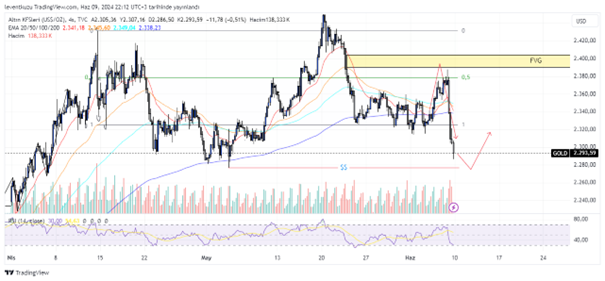
XAUUSD
4H analysis
4 H analysis of the last week was rather successful. The only issue was that the price could not reach the fair value gap zone. Instead of it equilibrium line of the range acted as a resistance. The price movement was quite satisfied. Now the price broke down to range low level. The probable reversal zone will be $2,280, where is a liquidity price. After removing this liquidity price can make a pull back to the recent fair value gap zones between $2,330 and $2,370.
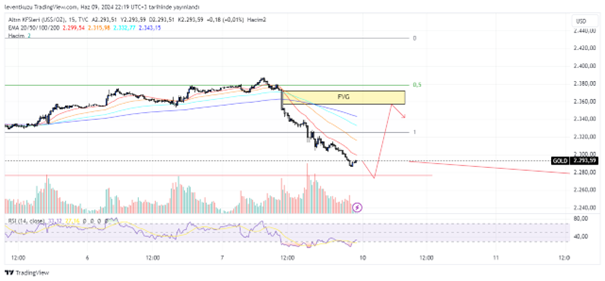
15 min analysis
In the current time frame, the refined fair value gap is between $2,360 and $2,370. The price and RSI started to generate bullish divergence. There is some evidence on a bullish movement. Price can move to the imbalance area after reaching the liquidity that was shown on 4H chart and also available in the chart of current time frame.
EURUSD
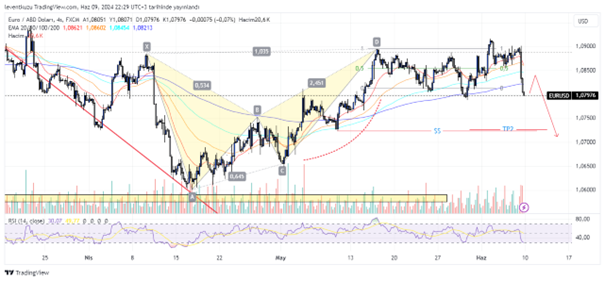
4H analysis
This is the third week that I am keeping the same analysis on 4H chart. The reason is that price was in a range. There was only some small deviations. This week the deviation was on the bullish side. After that, the price broke down to the sell side of the range. The first target of the harmonic pattern was achieved. The second TP is 1.073, which also coincides with the liquidity zone. The price will probably reach to that zone and it will help remove some of the group of liquidities, which is shown by a curve.
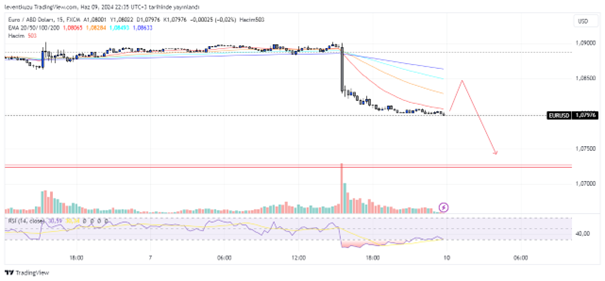
15 min analysis
The price of the pair dropped sharply, which generated a fair value gap zone. Although price is decreasing, the RSI is increasing. This shows a possible reversal into the FVG. After possibly reaching to EMA200, the price will continue its bearish movement until below liquidity zone, shown by the red line.
** Important Note: Above ideas are not investment advice!**