BTCUSDT
4H analysis
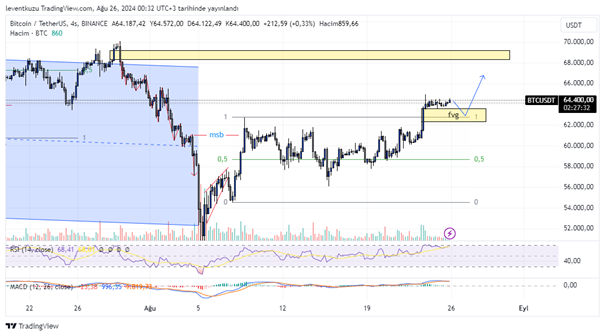
Two weeks ago, we identified the market structure as bullish on 4H chart. It is still valid and the range is broken towards the high level. This has left a fair value gap over range high. The price can retrace to range high to fix the imbalance. It this case, $62.5k is a logical place for a long entry. A two-sided imbalance is present above around $67k. It can be a significant target on 4H chart.
15 min analysis
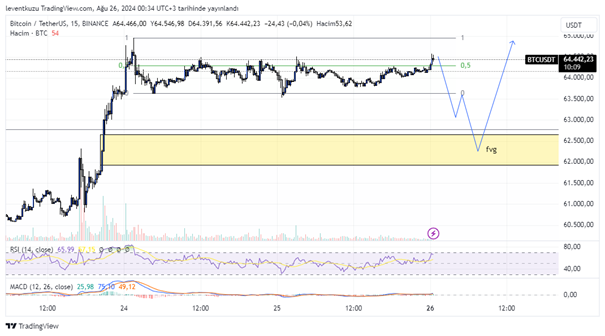
Chart of 15 min structure includes the targets for 4H chart. During the weekend, the price was within a range of around $1000. Now, the RSI is at over-bought. We may expect a break of the range from down to fill the FVG. The imbalance shown on the chart below is refined according to 15 min. therefore, it is a bit different from 4H chart. $62.5k is the upper boundary of FVG. After the fixation of imbalance, price can go upwards to reach higher prices.
XAUUSD
4H analysis
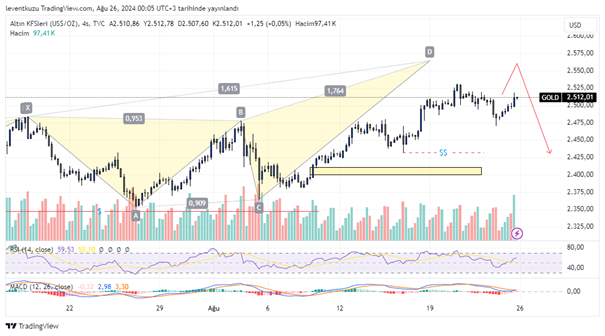
The expectation of this week is still compatible with the last week. We observed an increase and a decrease movement. The price level is still the same. Between $2,550, the formation of the harmonic pattern will be satisfied. The bearish deep crab, which is likely to be formed. D point should be at 1.618 of x-A leg. Once the formation is valid, the price can return from $2,550 until the liquidity below around $2,430. It also corresponds to fib 0.618 of the harmonic pattern.
15 min analysis
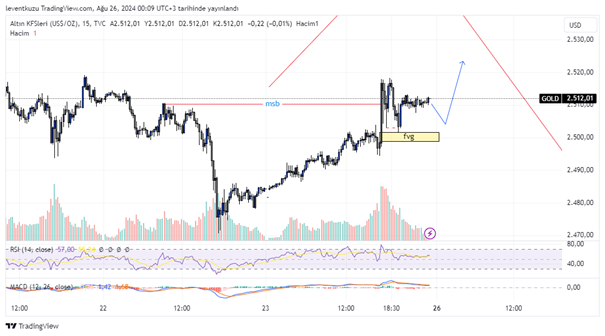
In the short term the structure turned to a bullish market structure. MSB realized by a strong candle. A FVG was occurred with the movement. Most of FVG was fixed and some inner liquidities were swept during the movement. An increase-ward movement is likely to happen compatible with the HTF analysis.
EURUSD
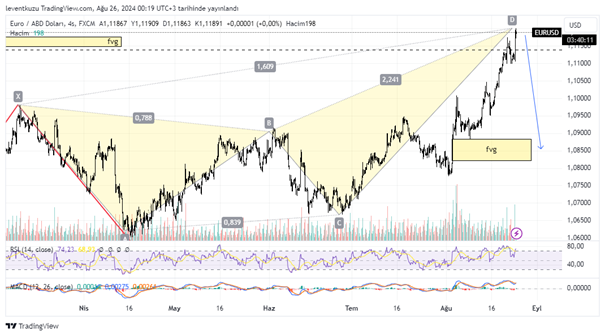
4H analysis
The price expectation of the last week was satisfied by the upward movement. The target was the dashed line. It also contradicts a lower high price on the daily chart. We can see a candle close over this price. Also a FVG was present on the daily, it is removed. All the metrics are now at overbought and it is logic to expect a correction. 1.085 is the target for the ready harmonic formation. The FVG also includes the fib 0.618 of the harmonic pattern.
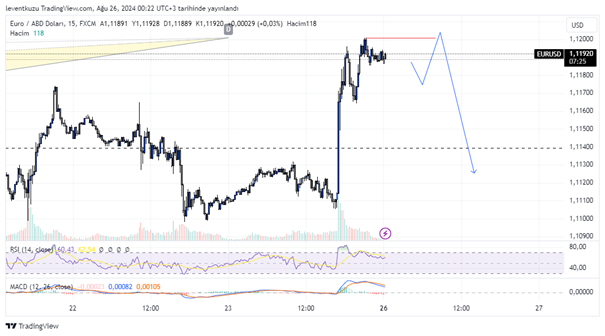
15 min analysis
There is a significant FVG available on the chart. The price pushed somehow a bit higher and removed an inner liquidity. One more liquidity can be swept and the below FVG and be filled. In this case, the price drop will be until 1.112 pair price.
** Important Note: Above ideas are not investment advice!**