BTCUSDT
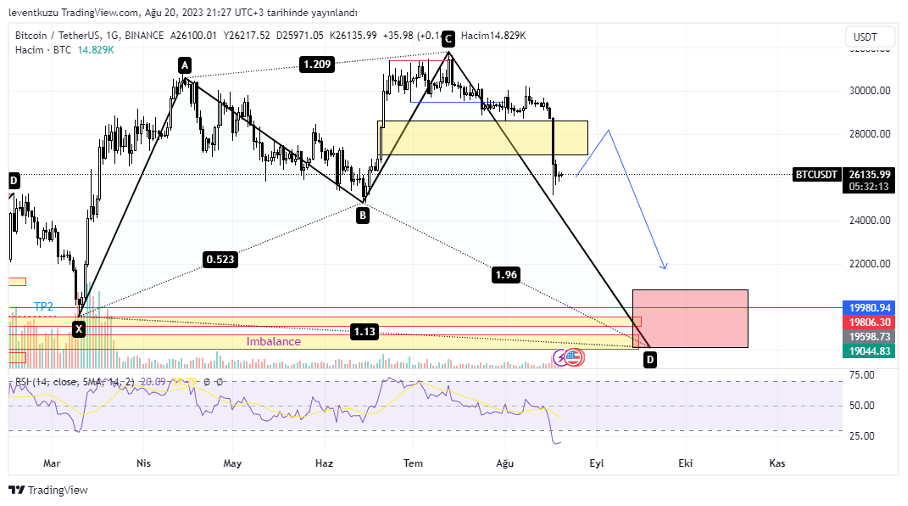
1D analysis
I have mentioned a possible bullish shark pattern two weeks ago. But also warned that it was just an imagination at the time of the analysis. Now, the formation started to form. D point should be fib 0.886-1.13 of X-A. In this case, the red box will be the target for the formation to be generated. We can observe some imbalance zones beyond X-A fib1.0 level. If price want to take the liquidity which corresponds to X price, then it would probably fill the imbalances underneath. In the current price level, we can observe a yellow box. It encapsulates one bullish and one bearish candle, which generated FVGs. By taking into account both the yellow box and the current state on RSI, first, we may expect a rise in the price until $28,000s. Then, we may expect lower prices.
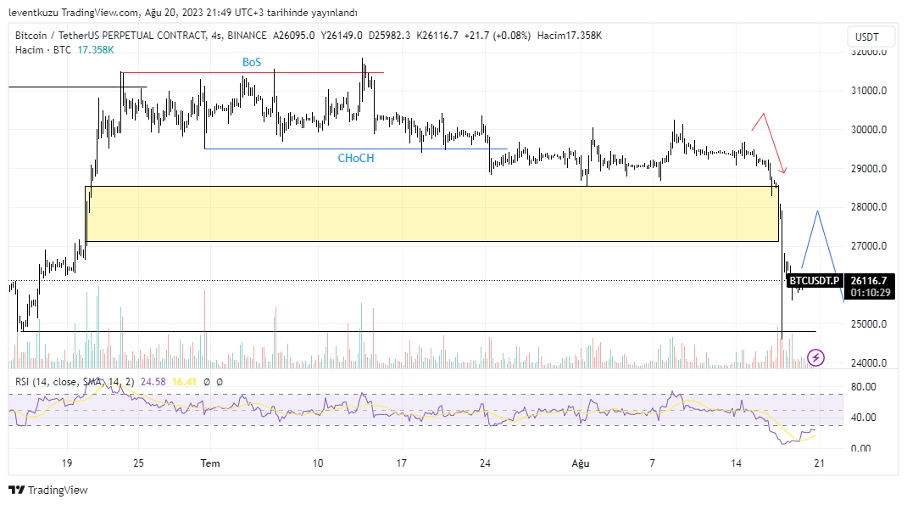
4H analysis
We were mentioning a possible descend in the price pf BTCUSDT for several weeks. But price could keep the same level although volume was quite low compared to previous weeks. At the end, price dropped sharply and took the liquidity around $24,800s. The red path was from last week, the blue one is the recent path depicting the expectation for this week. Price will want to fix bpr, which means a limited price rise is expected. But, one deeper price crush is possible. When we look at the market structure, we can observe that it turned to bearish on 4H timeframe previously. We can observe a bullish break of structure by the red horizontal line. The swing low point this is depicted by blue horizontal line is the change of character level. Price remained almost the same for one month although the structure was bearish.
XAUUSD
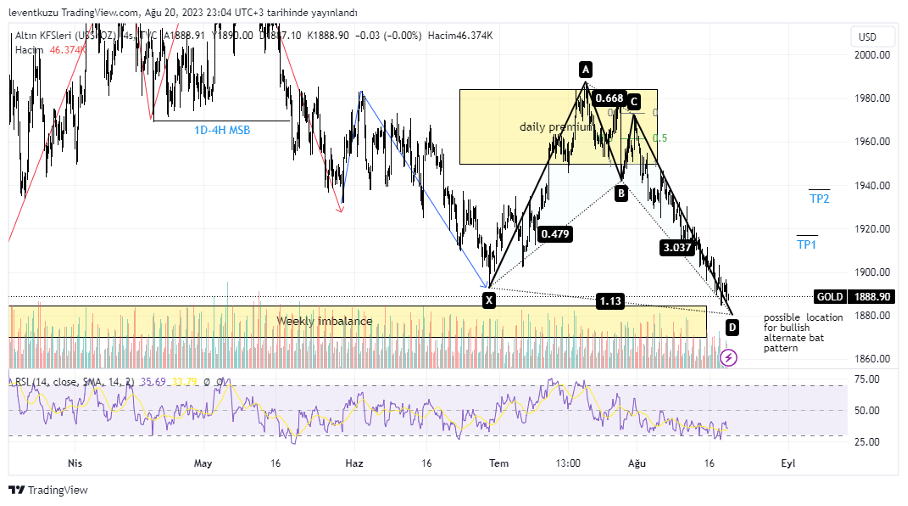
4H analysis
Price of gold is moving to lower levels and closing the weekly imbalance. Last week we expected a bullish bat pattern. There was an order block, which took liquidity. Actually, the orders filled at that level was not enough to carry the price to higher levels. The formation turned to a probable bullish alternate bat formation. In an ideal formation, fib 1.13 of X-A leg is the location of D point. In an ideal formation, price can reverse from $1,880. But the price is also closing weekly imbalance. If $1,870 is reached, then the imbalance will be repaired. For that reason, $1,870-1,880 is important for a long entry. TP1 and TP2 are $1,912 and $1,932, respectively for ideal bullish alternate bat.
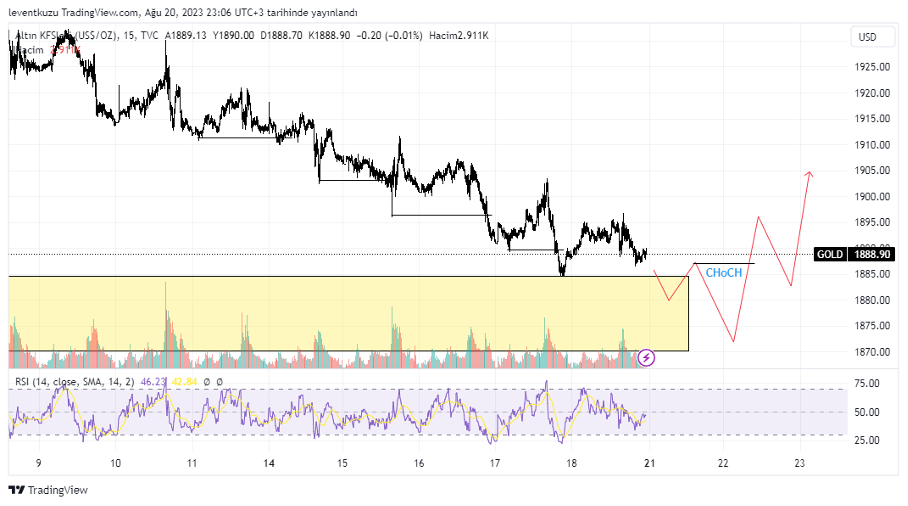
15 min analysis
Every black horizontal line on the chart is a break of structure and keeping the movement in the same direction. As in 4H analysis, somehow lower prices can be reached within the yellow box. We have to see a change of character as shown in the figure to enter a long position.
EURUSD
4H analysis
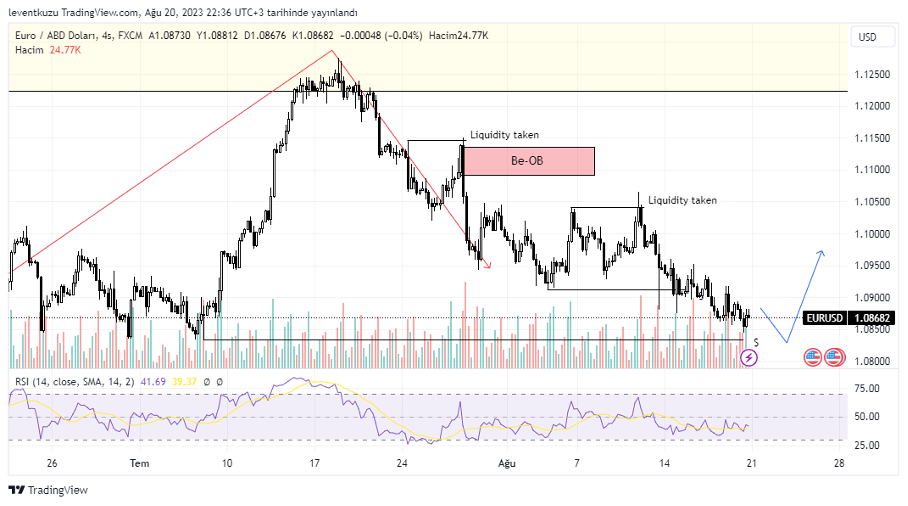
The daily market structure bullish. Several bearish formations occurred within 4H time frame. Pair price moved to lower levels after sell side liquidities were taken. A buy-side liquidity was taken at around 1.091. It was not enough to reverse the price. There is one more liquidity at 1.083. This is a critical and expected level. According to price action after the reach to the location, we may take position. If the momentum is enough to make a change of character, we may take a long position from a proper order block.
15 min analysis
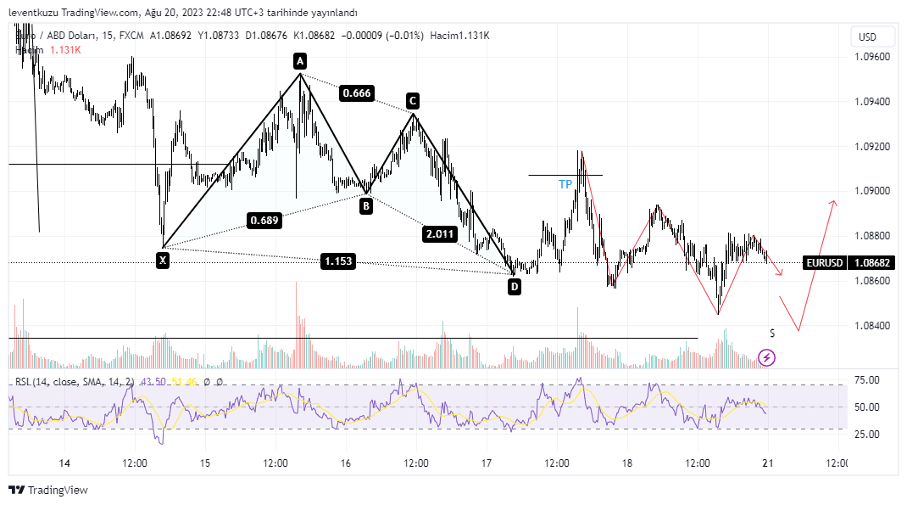
After forming the bullish shark pattern, price reached TP region and reversed from that level. After analysing the price structure, bearish structure is obvious. Current expectation is to reach 1.083 and possibly reverse from that price.
** Important Note: Above ideas are not investment advice!**
Nihat Çetinkaya
https://twitter.com/nhtctnk
I’m a private trader of over 7 years, based in Istanbul.
All trading and research are my opinion, not investment advice.