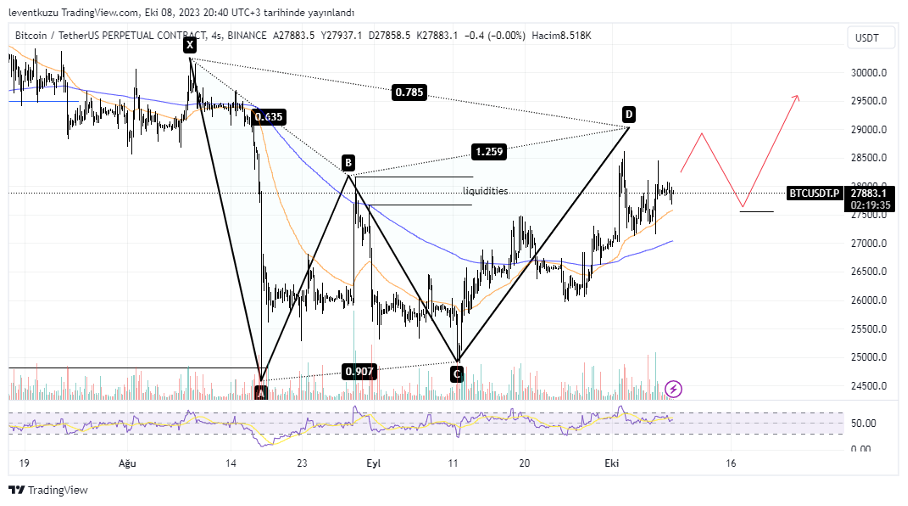
BTCUSDT
4H analysis
Over the last three weeks, Gartley pattern is forming on BTC chart. Price moved close to D day by day by rather shallow movements. Although, market structure is not bullish yet, I expect a correction from D point to fib 0.382 of C-D leg. Approximately MA200 will cross the same price. Then, correction price can be $27,500s. After that, price can keep its upward move and a MSB to bullish can be formed.
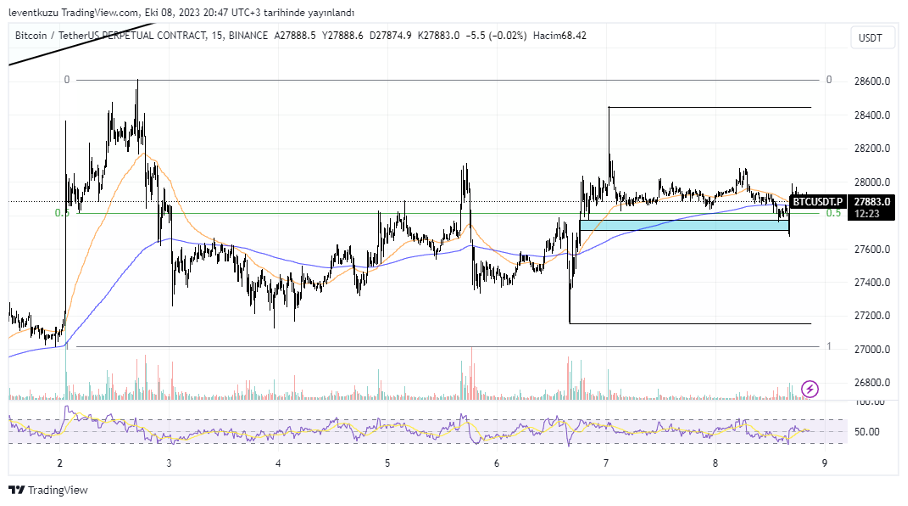
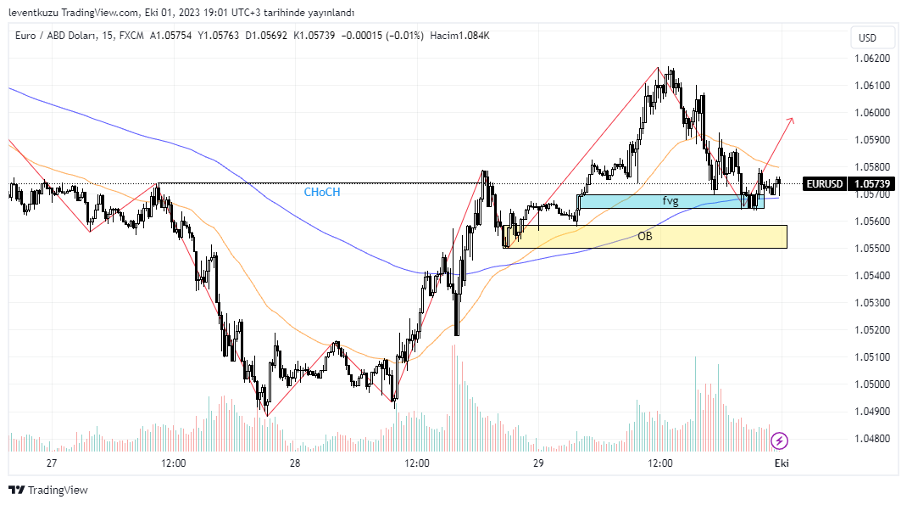
15 min analysis
There is not a clear direction on LTF chart. The price is within the drawn range. Price lays near the equilibrium of the range. FVG was swept and there are two open liquidities which are at both sell-side and buy-side. Their distance from range-high and range-low region is nearly the same. Although $29,000 is the nearest target for 4H chart, it is best to wait for a clear movement on LTF to enter a position.
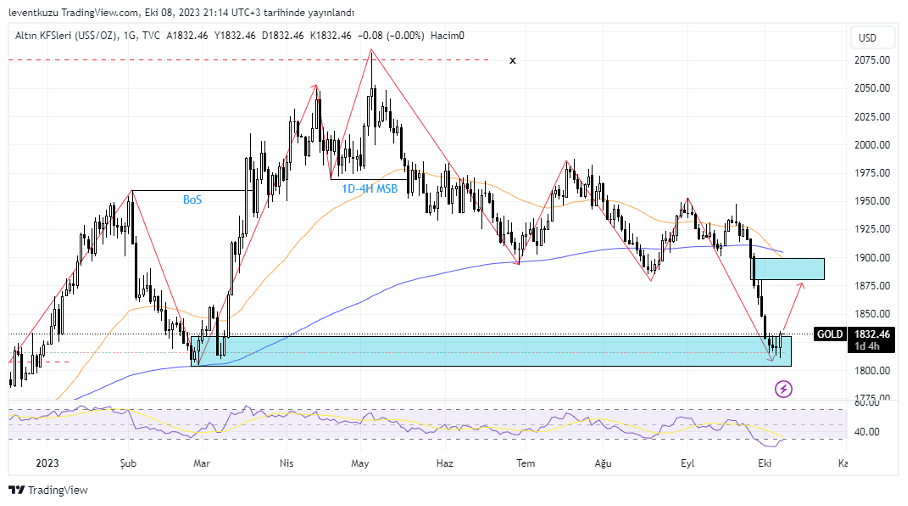
XAUUSD
1D analysis
The daily market structure of gold shifted to bearish on mid-May. Since then, price dropped regularly. Now the price reached a place where an order block is present. As we consider the candle reactions and current state of RSI, potential reversal is possible at least until $1,900, where fair value gap is present.
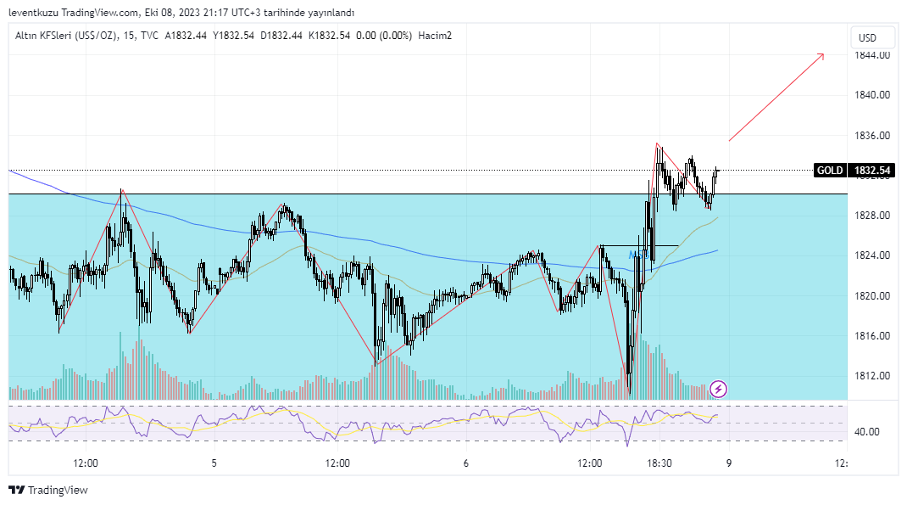
15 min analysis
A bullish change of character is present on 15 min chart. This is within the order block of daily chart. Additional indicator is that MA50 crossed over MA200 on bullish side. The LTF structure shift can support our HTF analysis expectation. $1,828 can be a good price for long position setups.
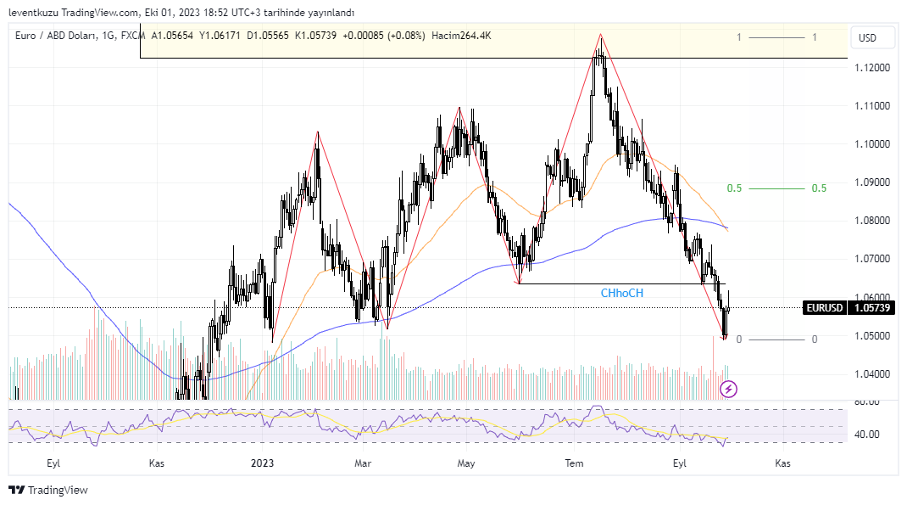
EURUSD
1D analysis
After making a CHoCH, both price and RSI gave initial signals for a possible reversal. The range is updated and new fib 0.5 level is 1.086. This is the price which differentiates premium and discount zones. This level should be reached for a swing short position. LTF entries can be done for a bullish entry.
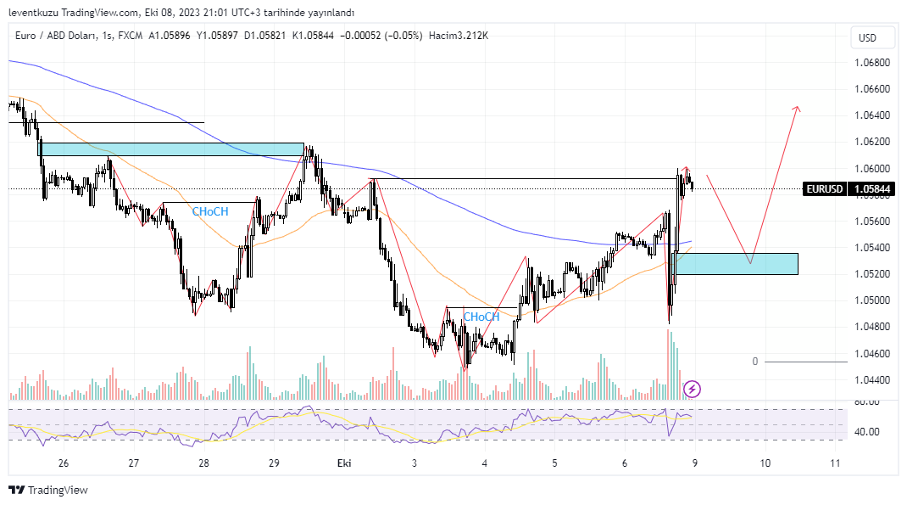
1H analysis
The first change of character was invalid. Price removed the fair value gap and continued to drop. Now it seems that price made a bullish market structure break and made a break of structure. This is a sign for the bullish continuation. The most likely movement of the price can be towards the fair value gap below, which is between 1.052 and 1.0535 pair price. Bearish RSI divergence is also obvious and can support this movement. After sweeping the FVG, pair price can increase.
** Important Note: Above ideas are not investment advice!**
Nihat Çetinkaya
https://twitter.com/nhtctnk
I’m a private trader of over 7 years, based in Istanbul.
All trading and research are my opinion, not investment advice.