BTCUSDT
4H analysis
Previously, we have identified a Gartley pattern. The traditional target for leg-D is 0.786 of X-A. However, there are other forms that can cause a zone that is called potential reversal zone (PRZ). When we consider AB extension fib1.272, BC inversion fib1.414, and AB=CD, the generated PRZ is shown by red colour. The price reached the zone and reversed by one single touch from AB=CD level. In this case, we should not wait for fib0.786 level of X-A leg. Another thing is that, a death-cross is likely to occur on 4H time frame.

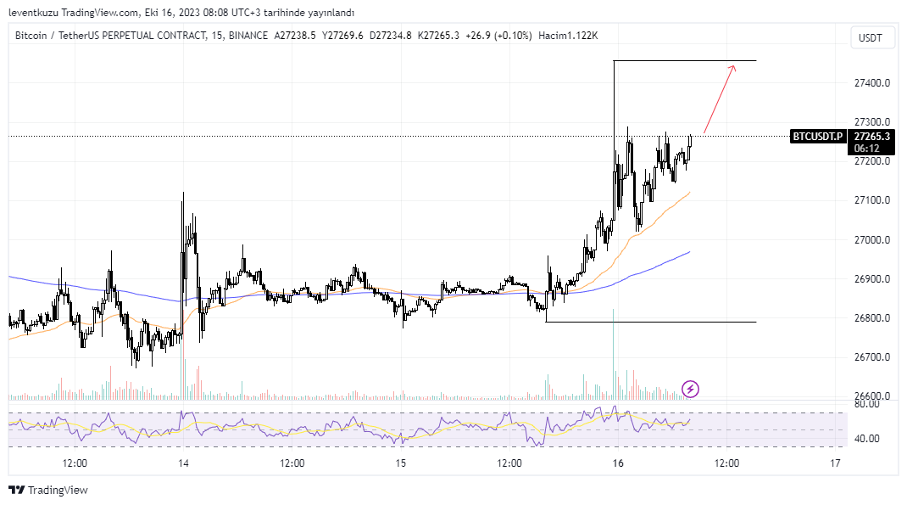
15 min analysis
In the LTF chart, BTC price exhibits an aggressive bullish movement. The price has to liquidities located at top and down. Current attitude is likely to sweep the liquidity at the top at first. After reaching $27,500s, we can think of possible reversals for HTF analysis. But in the current case, EMA50 is holding the price well on 15 min and there is not an exact sign for bearish movement.
XAUUSD
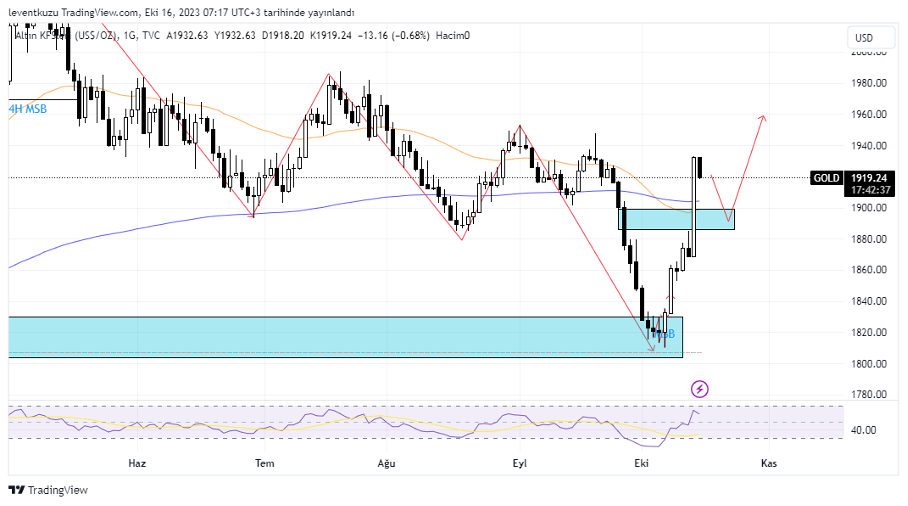
1D analysis
We realized last week that the identified OB held price well and the candle structures were appropriate for bullish movement on lower time frame. An imbalance zone was identified around $1890-1900s. The price reached there and went over the region by a strong candle. In the new form two opposite imbalance candles were formed. The new target is again $1,890-1,900s, then we may expect the price move higher levels. Although the price seems bullish, in daily the market structure has not shifted yet to bullish.
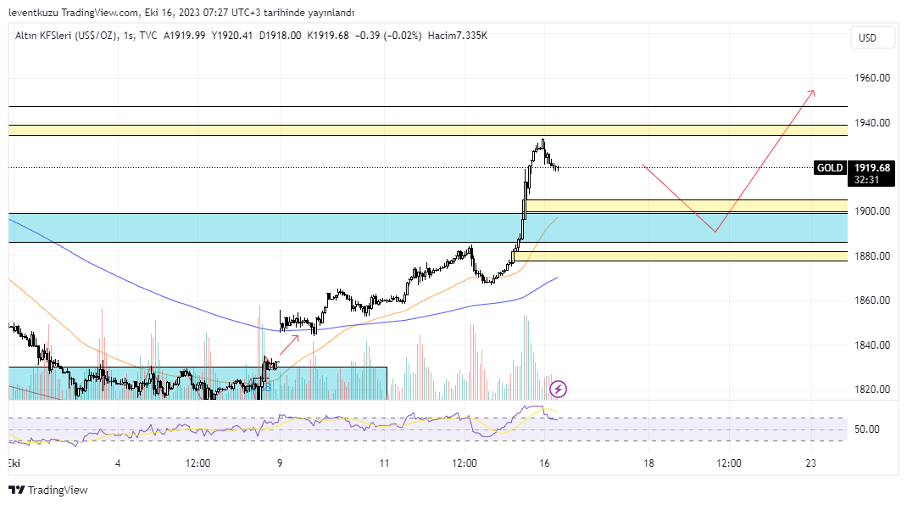
1H analysis
As to start with the market structure, we can observe a bullish market structure for the current time frame. EMA50 crossed EMA200, this also another indicator showing the shift of the structure. An imbalance zones for two opposite candles are available around $1,940s as with the 1D analysis, which is shown by yellow box. Also, a liquidity is present around $1,945. The price reached close to those levels but neither closed the imbalances nor swept liquidity. There are other imbalance zones available in cheaper prices for 1H chart that are shown by yellow rectangles below the current price. As with the HTF analysis, price can move to lower prices and then continue its bullish movement.
EURUSD
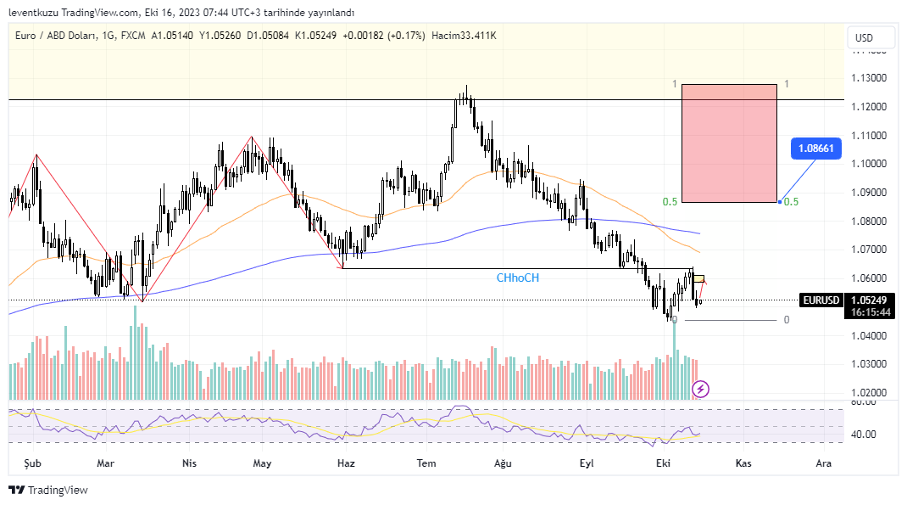
1D analysis
After making a CHoCH, both price and RSI gave initial signals for a possible reversal. It escalated to higher prices until the CHoCH level. There was a strong reversal there. Now, the most likely target is the premium zone, which is shown by a red rectangle. Fib 0.5 level of the last down leg, which made CHoCH, is 1.086. This level should be reached for considering possible short positions.
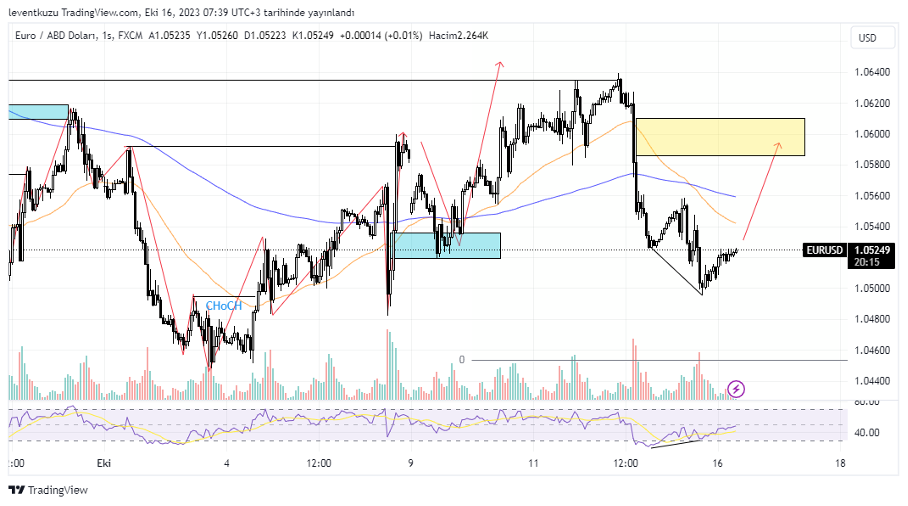
1H analysis
The first change of character was invalid. Price removed the fair value gap and continued to drop. Noe it seems that price made a bullish market structure break and made a break of structure. This is a sign for the bullish continuation. The most likely movement of the price can be towards the fair value gap below, which is between 1.052 and 1.0535 pair price. Bearish RSI divergence is also obvious and can support this movement. After sweeping the FVG, pair price can increase.
** Important Note: Above ideas are not investment advice!**
Nihat Çetinkaya
https://twitter.com/nhtctnk
I’m a private trader of over 7 years, based in Istanbul.
All trading and research are my opinion, not investment advice.