BTCUSDT
1W analysis
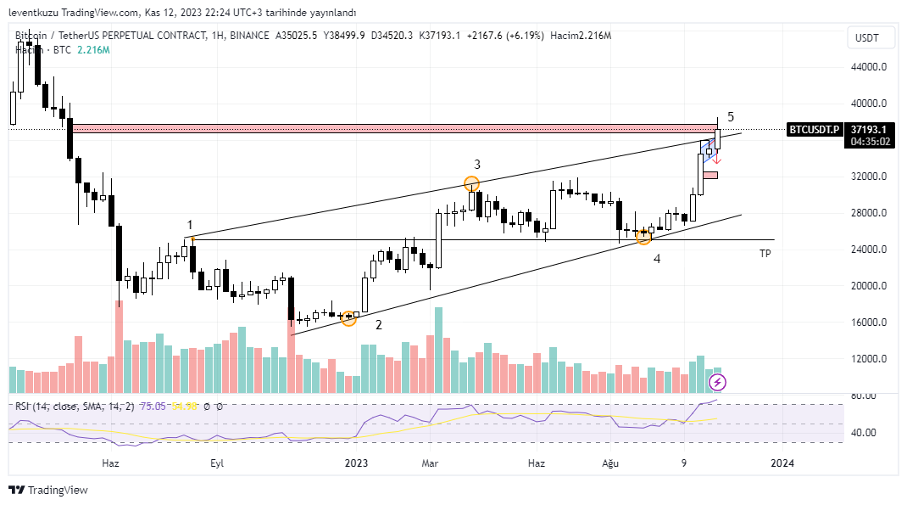
Last week we mentioned about a Wolfe pattern on the daily chart. The fifth touch of the waves manipulated the trends on the pattern. Therefore, we aimed to look from a higher time frame view. There was an imbalance (daily) which was shown by the red rectangle. It was swept by the last move of this week. The body of the candle is within the box. The close of this week will be important to ensure whether this is a manipulation or continuation. RSI is obviously in over-bought region on the weekly chart. There are signs for possible reversal reason.
4H analysis
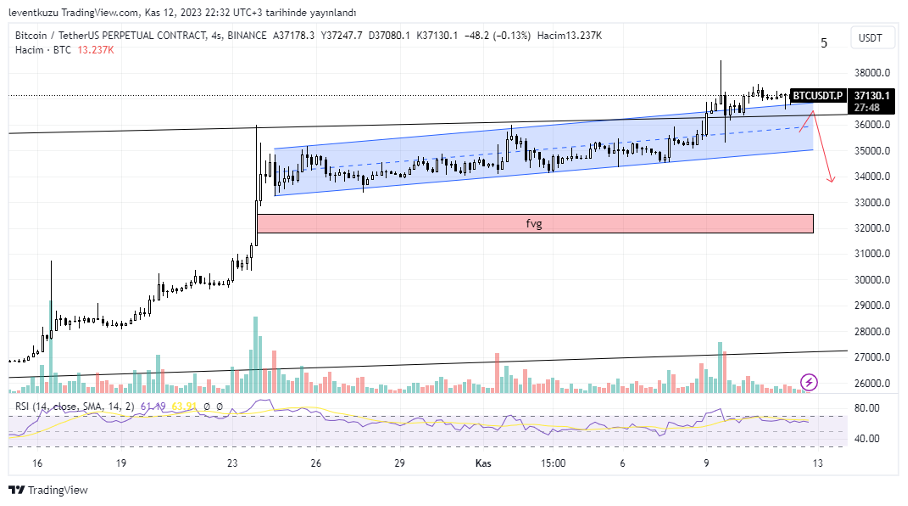
Looking at the 4H chart, we have to be cautious by the current signs. First, the price trapped within a narrow price span. Second, there is a sharp volume decrease. RSI is showing a decrease in the momentum. According to these negative signs, the RSI located below can be the closest target.
XAUUSD
1D analysis
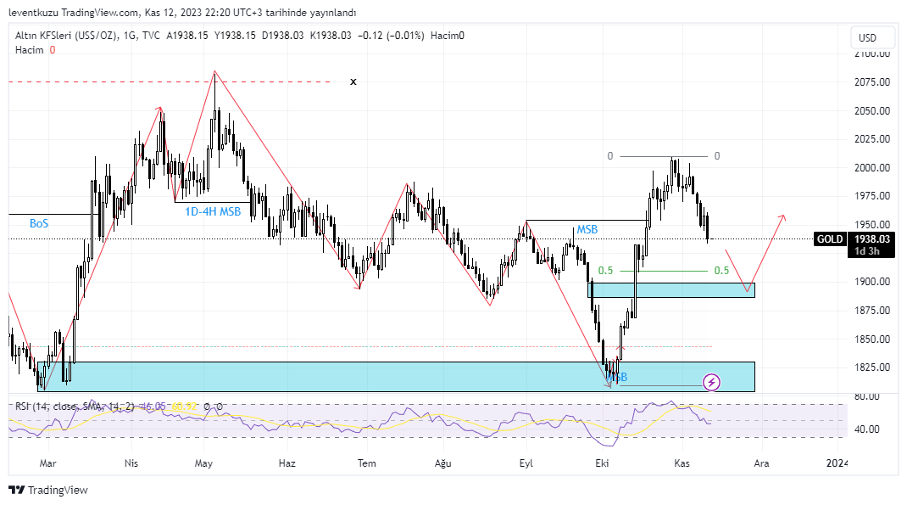
After making the market structure break, price is still moving to our daily target, which was between $1,880-$1,900 zone. It is also close to fib 0.618 of the last leg. $1,910 corresponds to fib 0.5 level, which is a transition point from premium to discount.
4H analysis
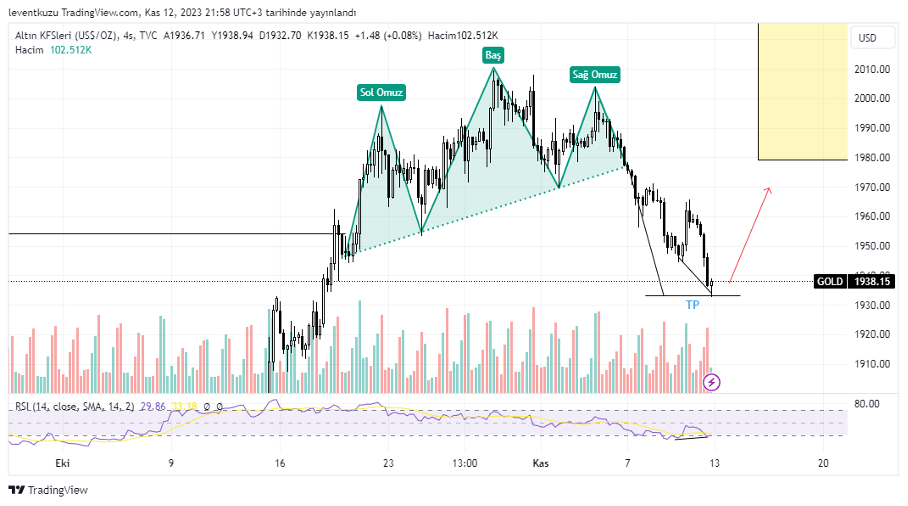
A shoulder-head-shoulder formation has become obvious last week. The price reached to its take profit level. A bullish RSI divergence is present for 4H time frame. Price of gold can somehow move higher prices before it makes a new low which was shown 1D analysis.
EURUSD
1D analysis
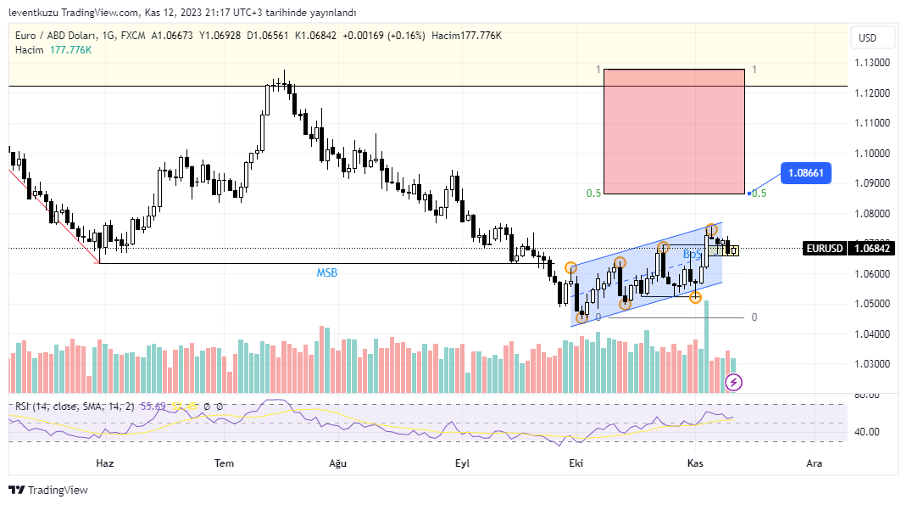
High time frame analysis of this week is from a daily chart. On 4H, pair was making higher highs and higher lows. On the daily, they seem to make an ascending channel. The channel was manipulated to sweep some liquidity. On the other hand, we identified a fair value gap on 15 min last week. The pair price removed the FVG and ready to continue its bullish movement until 1.086s.
1H analysis
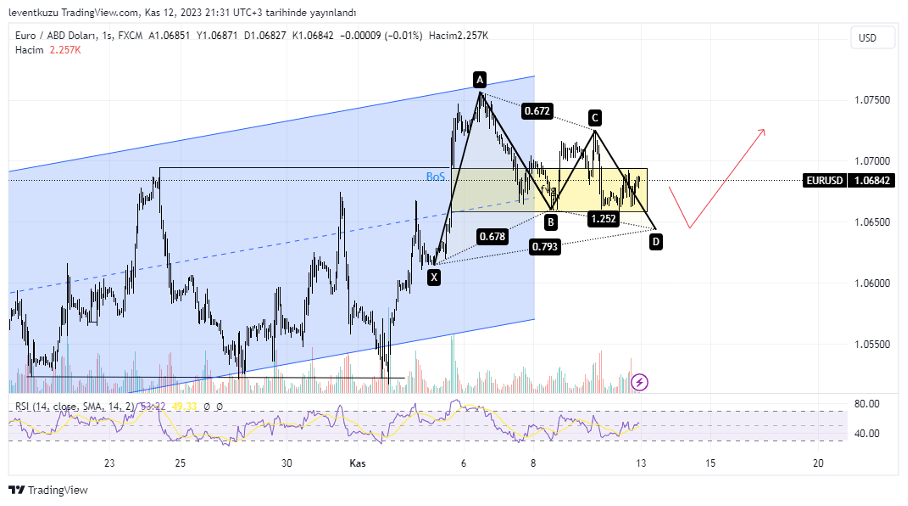
After making a break of structure last week, the price reached to the identified fir value gap. It is more visible on this time frame that price reacted well within the yellow FVG zone. The price movement is close to a Gartley harmonic pattern. Therefore, we may expect some more price reversal until 1.064 level. But this is not a perfect place for AB=CD of the pattern, if it will the target, then 1.063 can be reached. As this is a bullish pattern, price should continue to higher levels.
** Important Note: Above ideas are not investment advice!**
Nihat Çetinkaya
https://twitter.com/nhtctnk
I’m a private trader of over 7 years, based in Istanbul.
All trading and research are my opinion, not investment advice.