BTCUSDT
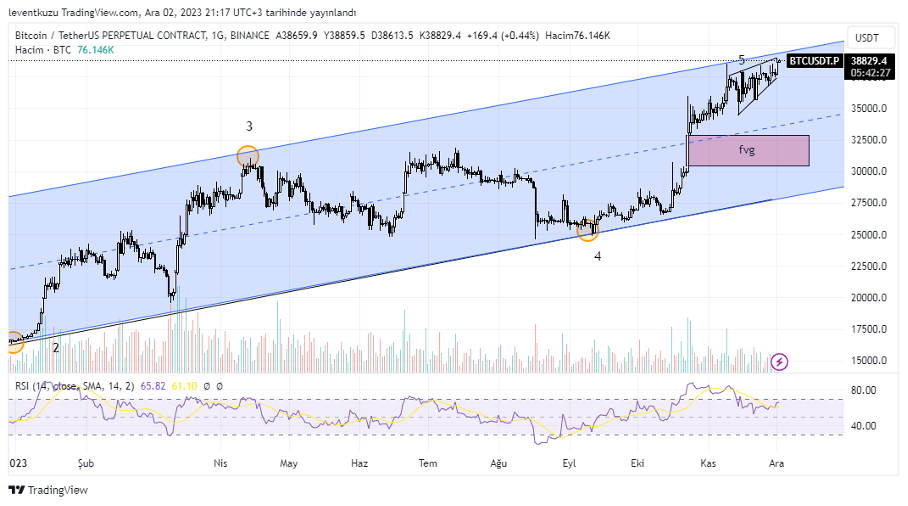
1D analysis
Price of BTC is still within the ascending channel. There is no reversal signal in the market structure. However, bearish signals arise from the chart and indicators. Price is increasing after making a fair value gap since mid-October. Controversy, RSI is dropping on the daily. There is an ascending narrowing wedge, which is clearer on a lower time frame chart. If the price starts a correction, below fair value gap zone will be the target.
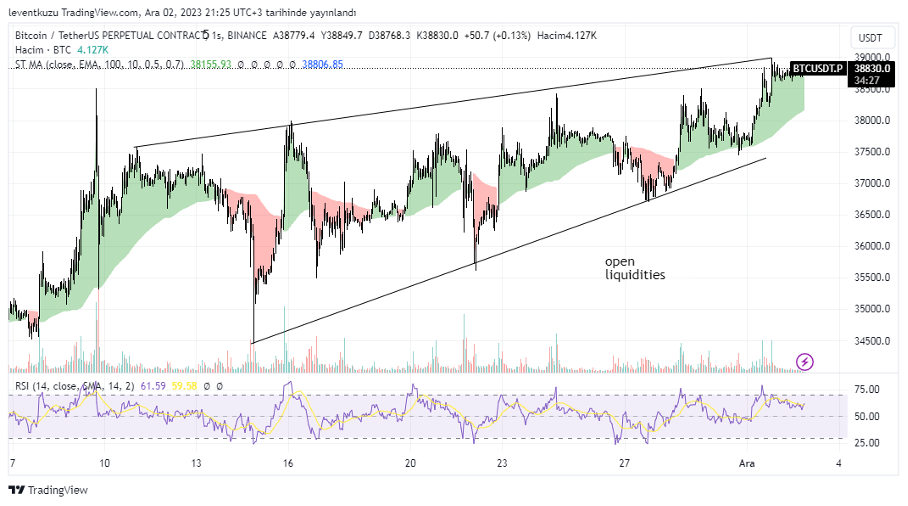
1H analysis
The ascending wedge is obvious on 1H chart. Price is also oscillating around EMA100 curve. Therefore we can see sequencing green and red colours. The areas with red colour has always been corrections of each up-leg movement. But these result in producing open liquidities. Price may want to sweep some of them. If price wants to take the liquidity, the first target will be $36,750s. Further price comments can be done according to LTF chart confirmation.
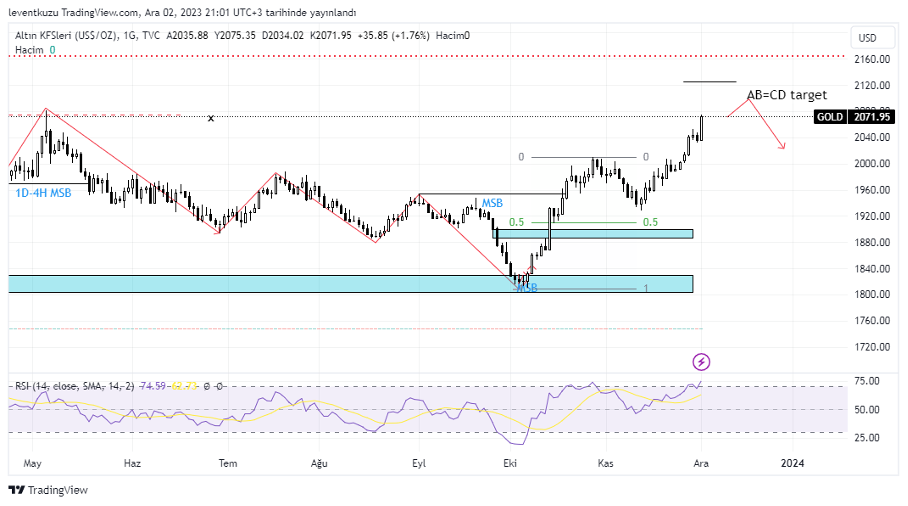
XAUUSD
1D analysis
We proposed one bullish and one bearish scenario two weeks ago. The bearish scenario was cancelled last week. In the bullish scenario, price can reach to AB=CD target, which is around $2,120. On the other hand, price is close to a previous swing point. The RSI is in the overbought region. In this case, we should be careful when the price over $2,100. A probable reversal can occur. However, this can just be a correction.
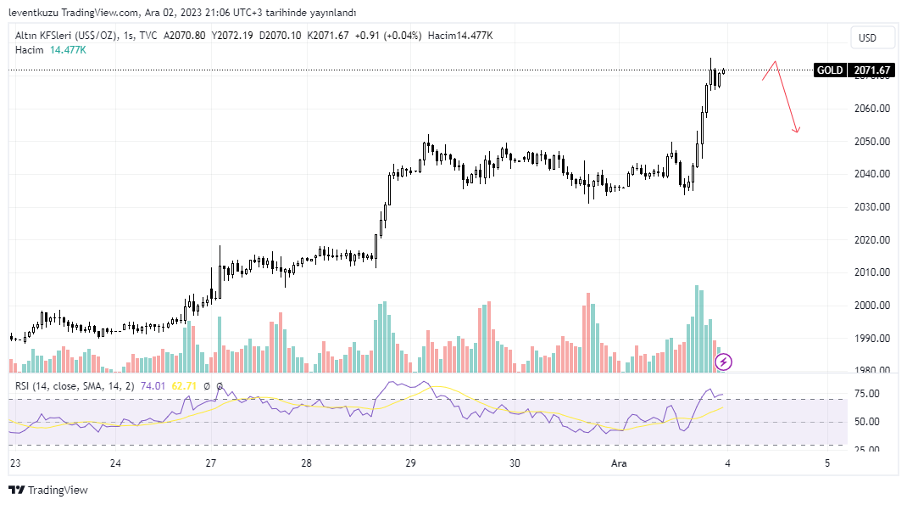
15min analysis
In the 1H chart, bearish RSI divergence is obvious. Care should be taken from now on. However, price can move somewhat higher although there is RSI divergence. The available fair value gaps are not much high to attract the price. Therefore, some more high levels can be possible in this time frame chart.
EURUSD
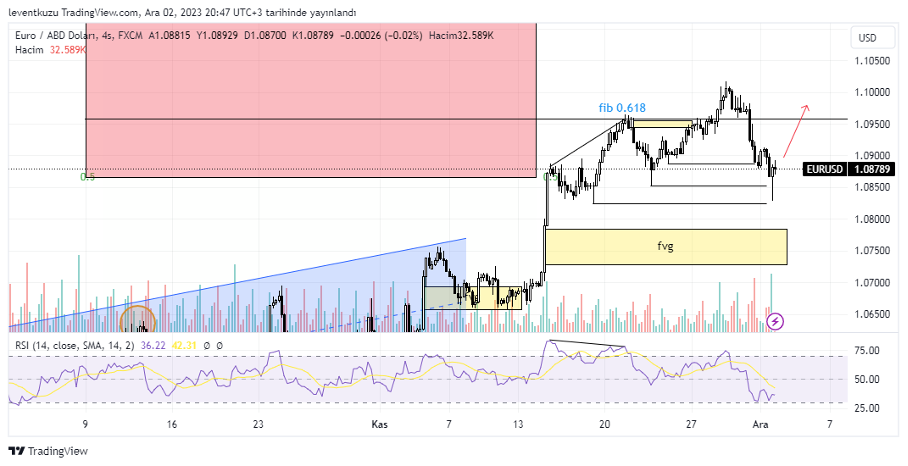
4H analysis
In the 4H analysis of the last week, we expected the price to reach the fair value gap zone. It really did the correction movement but just took two of the three liquidities. In the current case, RSI is close to oversold region. We can now wait for a new break of structure by passing the last higher high. Then, we may expect 1.075s to sweep open liquidity and close the fair value gap.
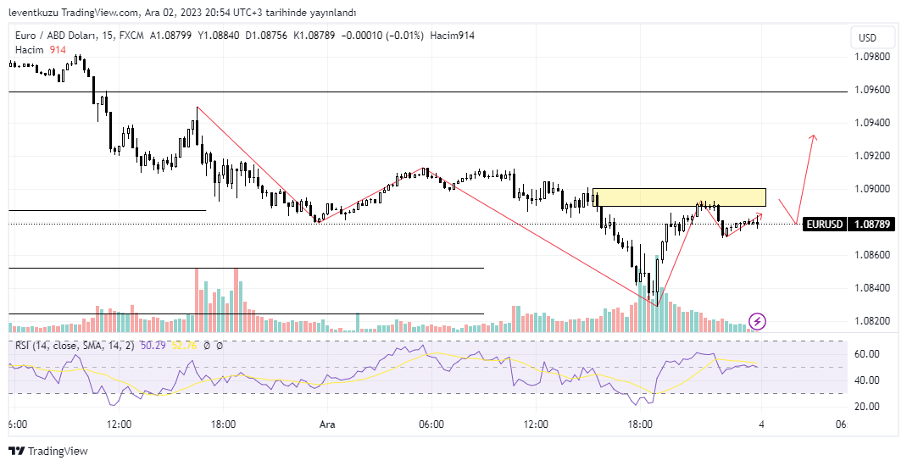
15 min analysis
Market structure is bearish on 15 min chart. There is not a clear sign of reversal so far. The yellow box can be considered as a bearish order block because price dropped by a momentum and the candles are relatively larger than the surrounding price bars. There is a confirmation due to the reaction of the price from that region. But price wants to retest the area. If it is able to break the block, then we may expect the price rise as with HTF analysis.
** Important Note: Above ideas are not investment advice!**
Nihat Çetinkaya
https://twitter.com/nhtctnk
I’m a private trader of over 7 years, based in Istanbul.
All trading and research are my opinion, not investment advice.