BTCUSDT
1W analysis
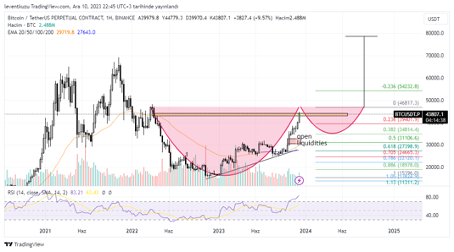
There were several bearish scenarios on daily and 4H charts. But they were invalidated by the movements of BTC. Actually, the price movement of BTC was a cypher pattern between late-2020 and mid-2022. Its target was around $48,000. Price is close to TP2 of the cypher pattern. If price moves somewhat higher, then we may expect a cup-handle formation. In this case, price can reach to fib 0.382 of the cup move, which is around $34,800. If FVG and open liquidities are targeted, a deeper correction can be $31,000s. RSI shows that it is in the overbought region and shallow or deep correction is possible. HFT target of this formation is $79,000.
4H analysis
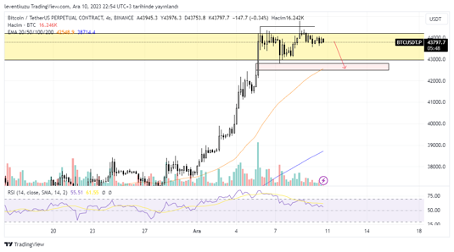
Previously, the yellow box was prepared, which show us a very early point of interest. It was a fair value gap on HTF. During the consolidation, price took liquidity. Additional signal is the louse of momentum according to RSI drop. First potential target is $42,500. Then, we may think about the next movement whether it will be bullish or bearish according to market structure.
XAUUSD
1D analysis
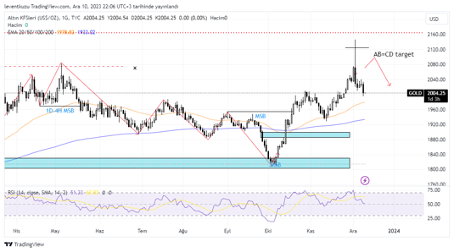
Our projection of the last week was an AB=CD pattern, which had the target of $2,100. The price of gold obeyed the formation and reached to $2,100. The price was reached by a wick. Now, reversal of the formation was started. Fib 0.618 of the formation approximately corresponds to MA200 of the daily bar charts. $1,940 is the most likely bullish reversal price.
1H analysis
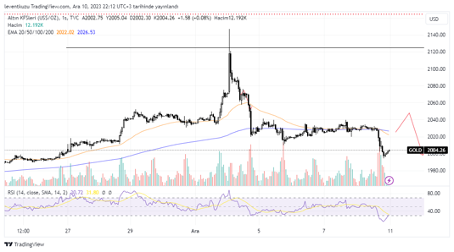
Price quickly reach the HTF target and dropped with a stronger momentum. At the last strong candle fair value gap was generated. It was swept almost entirely. EMA50 and EMA200 held the same line and then another bearish movement was observed. RSI reached to oversold region at the meantime. Now, price can increase to $2,030s, and then can continue its drop further.
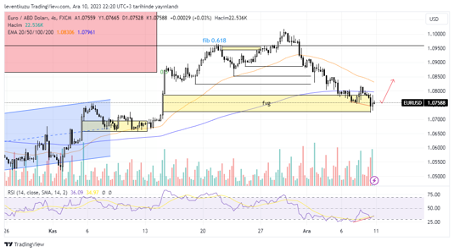
EURUSD
4H analysis
In the 4H analysis of the last week, we expected the price to reach the fair value gap zone. It closed the gap just the last week. Last week only two of the liquidities were swept. Now, we have no more open liquidity neither fair value gap. Additionally, a bullish RSI divergence is present in the chart. It is shown by red lines. Price is about to increase. The first target can be above the last higher high, which is about 1.082 pair price.
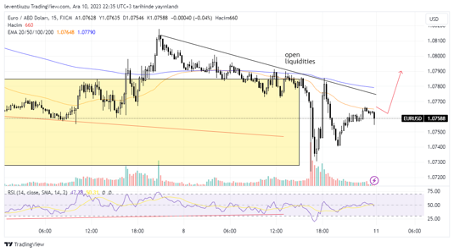
15 min analysis
15 minute chart has numerous open liquidities. There are 5 possible target liquidities on the bullish side. Therefore, there is reason for the fair price to remove these liquidities and as with the higher time frame analysis, first target is likely to be 1.082. after reaching this value, further analysis will be made for reversal movements.
** Important Note: Above ideas are not investment advice!**
Nihat Çetinkaya
https://twitter.com/nhtctnk
I’m a private trader of over 7 years, based in Istanbul.
All trading and research are my opinion, not investment advice.