BTCUSDT
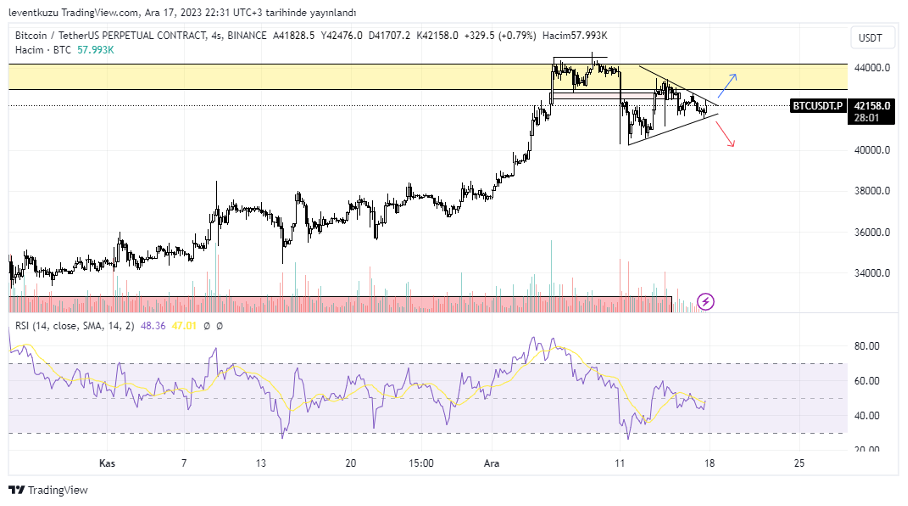
4H analysis
The liquidity sweeping, RSI decrease and the below fair value gap was significant indicators for us for an impactful fall of the price. It really reached FVG and went somewhat below that value with just one candle. The price is consolidating within a symmetric triangle. Such structures has potential of two sided movement opportunities. The decision should be given after the movement of the price. First break and potential mitigation should be taken into consideration.
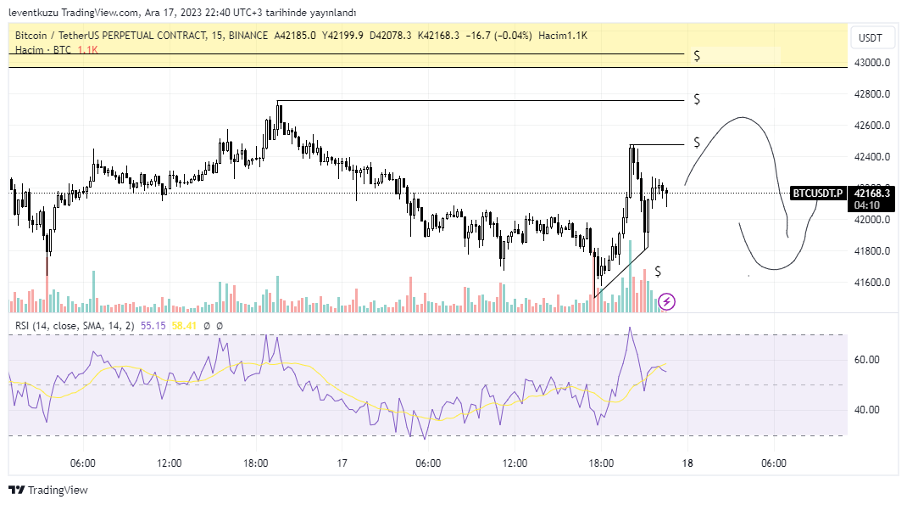
15 min analysis
As with HTF analysis, there are open liquidities below and above the current price with similar potentials to attract the price. Again as mentioned earlier, it is not easy to know the exact first movement. We should make our decision according to first movement. After sweeping one side liquidities, price will probably reverse and take the other liquidities. We should enter any position as the opposite of the first movement after taking the most extreme liquidity.
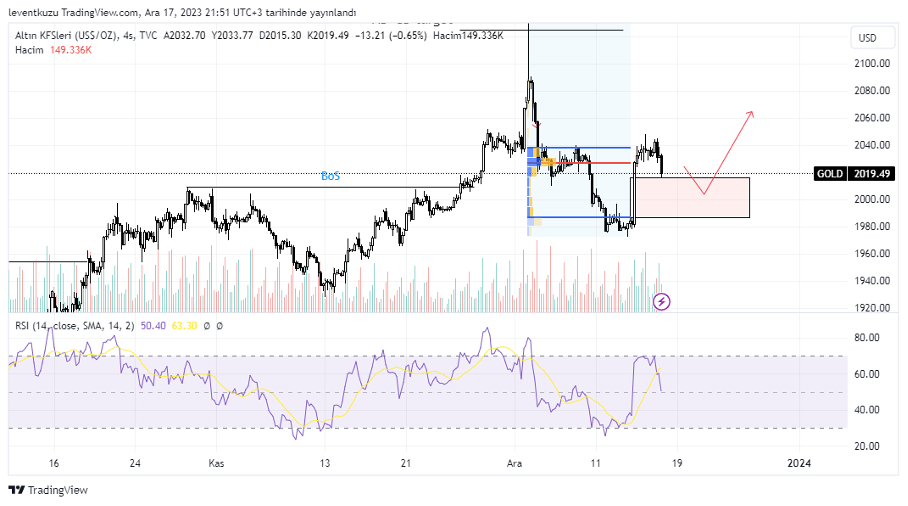
XAUUSD
4H analysis
The market structure of gold is bullish, the price made a break of structure, showing its continuation in bullish side. After the corrective move of the bullish leg, price moved up by a candle with a significant fair value gap. According to volume profile, the lowest trade volume was around $2,000. That means there was not an equilibrium between buyers and sellers. Price may want to retest that value. Then, we may expect the continuation of the current structure to upper values.
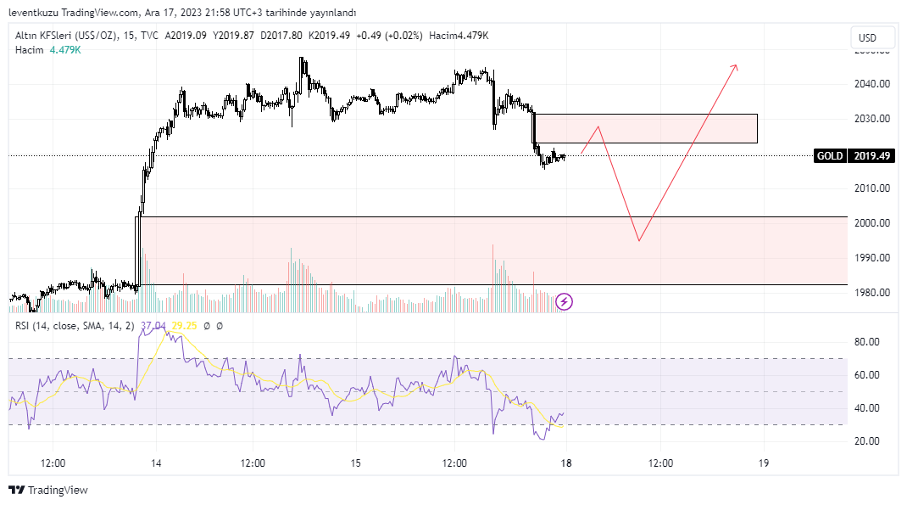
15 min analysis
A more detailed picture of the pattern is available on 15 min chart. There are some more fair value gaps that are invisible on HTF charts. There was a price increase since December 14th, although RSI was losing its momentum. This was a bearish sign on 15 min chart. The price dropped and reacted that bearish call. During the price drop, it left fair value gap apart from the large one which is between $1,980-2,000. According to LTF chart, price can first sweep the closest FVG and then target the further FVG. After all, we can expect HTF analyse targets.
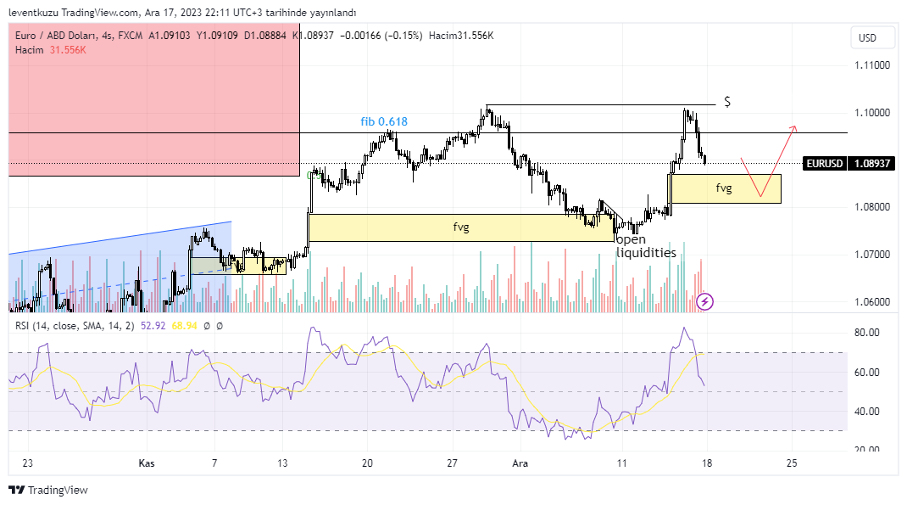
EURUSD
4H analysis
Price of EURUSD pair has a bullish structure on 4H chart. After the last swing high, price came close to make a BoS, however, it could neither took liquidity nor made a BoS. In the current form, it seems as a mitigation. RSI has a bearish divergence. Therefore, it can move within the fair value gap. Then, we may expect continuation of the price on bullish side.
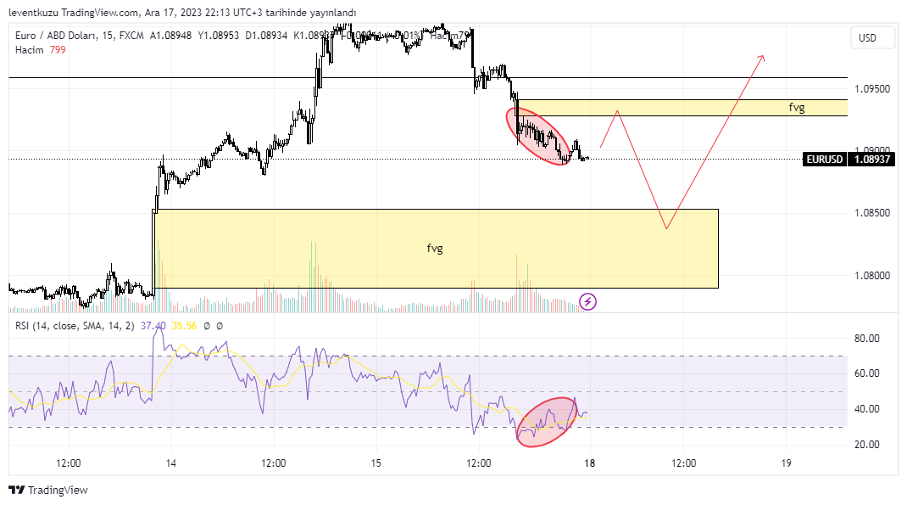
15 min analysis
15 minute chart a bit differed from 4H chart by having some more minor FVGs. A remarkable fair value gap is available at around 1.094 with a significant bullish RSI divergence. In my opinion, the first target will be the closest FVG. Then, we may expect the pair price to reach the fair value gap located below. At the end, HTF structure can be followed for the continuation of the structure.
** Important Note: Above ideas are not investment advice!**
Nihat Çetinkaya
https://twitter.com/nhtctnk
I’m a private trader of over 7 years, based in Istanbul.
All trading and research are my opinion, not investment advice.