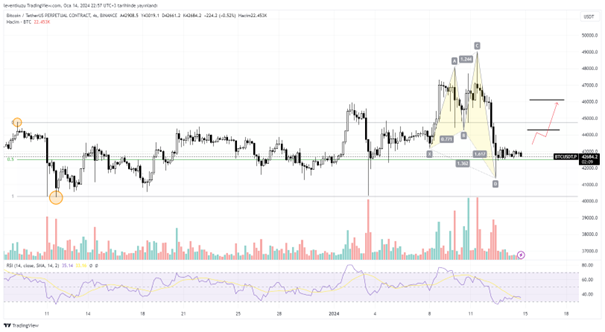
BTCUSDT
4H analysis
There was a range starting from the beginning of December 2023. In the last week’s bulletin, we expected a range manipulation above and actually, the price reached $49k level. Price instantly moved inside the range and 0.5 level of the range held the price well. The last wick formed a swing failure pattern, which is a reversal sign. Also, we can see a bullish shark pattern. The TP1 and TP2 targets of this harmonic pattern are $44,300 and $46,100, respectively.
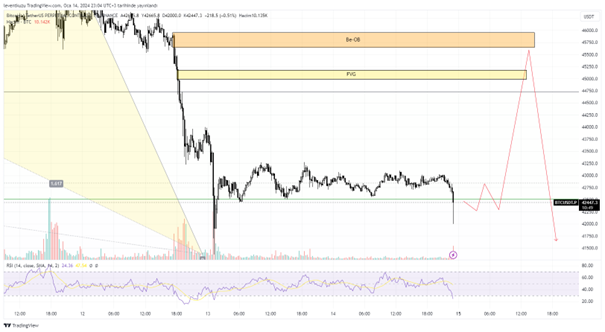
15 min analysis
The short term chart for 4H is depicted with 15 min. Bearish order block is just below $46,000, which is nearly same with TP2 of the harmonic pattern on 4H. After testing that level, we can expect a reversal. Since there was a swing failure pattern on higher time frame chart.
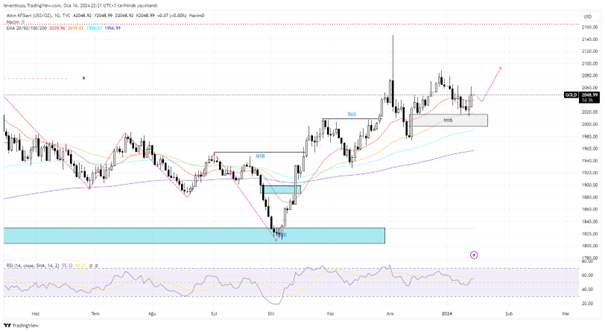
XAUUSD
1D analysis
Daily analysis of the last week worked well since the imbalance zone was tested and EMA 50 was crossed. Although our expectation was $2,000-$2,015, the reached lowest price was $2,013. That means, there are still some more gaps below. There is not a clear sign of bearish scenario at the moment for the daily chart. So that, we expect the price to move upwards.
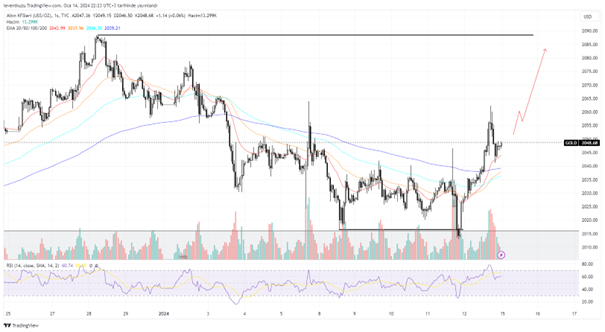
1H analysis
The liquidity below was swept and the imbalance zone was tested below the swing low point. The market structure was shifted to bullish on 1H time frame. Also, EMA200 was broken upwards, which is another bullish market sign. It was tested just after the break and the price kept its positive move. The swing high at around $2,090 is the next possible target.
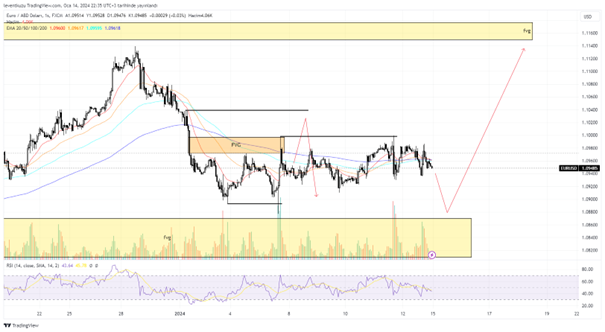
EURUSD
1H analysis
Any significant price movement didn’t occur since the last week. After reaching the liquidity the target could be the fair value gap below. Actually, it is still the target on 1H chart. The liquidity which filled FVG was swept. It somehow generated a downward momentum. Although four different EMA levels are on the same level, the drop of RSI is obvious. Price candles can move towards the fair value gap below.
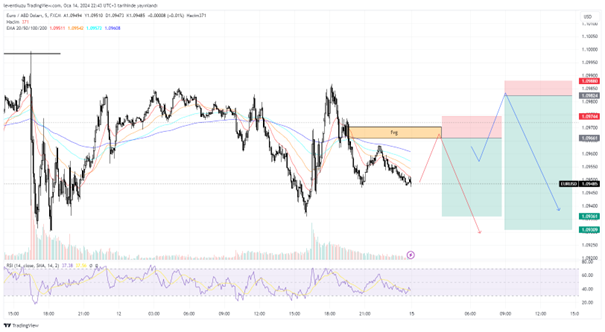
5 min analysis
On the left of the figure, bearish candle and its strong momentum is obvious. price tested the order block formed during that downward move. If we consider the strong move a range, price has not broken that range yet. Inner liquidities are open right now and they can be target. the fair value gap above can push the price downwards. A short position can be taken there. But there is possibility for the price to move some more higher levels. if that happens, second entry point can be another entry point. So one can try the first position just with 0.5R and the next 1R. The target can be the inner liquidity level.
** Important Note: Above ideas are not investment advice!**