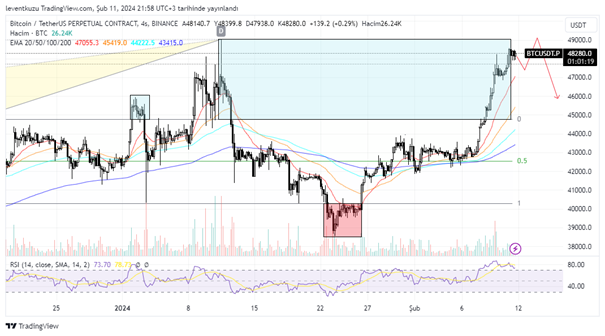
BTCUSDT
4H analysis
Previously we expected a test to range high. It was broken and price increased sharply as it decreased. The price reached the liquidity levels. But it has not taken yet. There is RSI divergence. This can suggest a sign for reversal. But BTC can increase although two lower highs forms in the RSI. Therefore price can increase some more and then make a correction possibly to range high level.
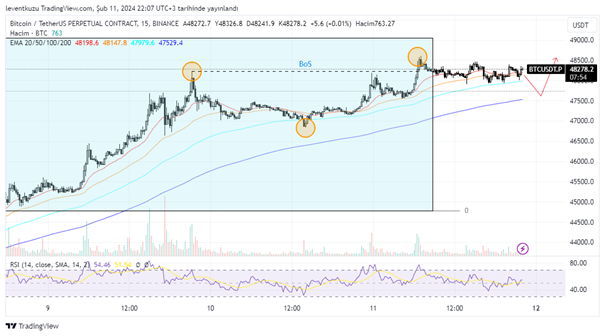
15 min analysis
There is a bullish continuity on 15 minute chart. Price made a break of structure. A correction is possible to remove internal liquidities present on the chart. If it happens, t will probably be around EMA200. Upon a touch to that level, we may go long on the price.
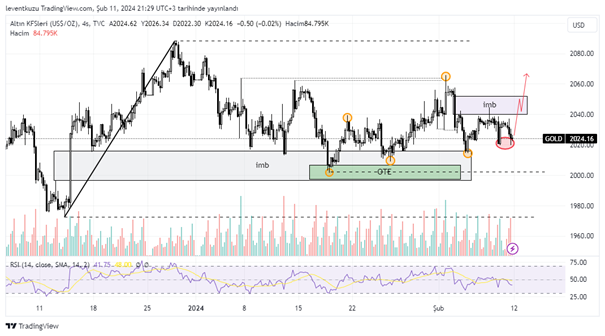
XAUUSD
4H analysis
Gold is removing internal liquidities for a long time. We expected the imbalance to be removed last week. But the price tapped there and then moved to sweep some sell-side internal liquidities. Double bottom was formed as shown by the red circle. Price can now move upwards. The extreme dashed liens shows the prices that should be reached to make a break of structure or market structure break.
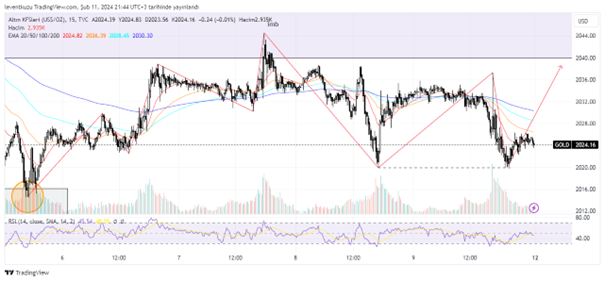
15 min analysis
There is a visible three impulsive bullish moves with two minor corrections and then a bigger move occurred. Instead of naming is as break of structure, we can think of a possible inducement, which removed internal liquidities. After that price formed double bottom. There is not a significant risk unless there is a candle close below the value that is shown by yellow circle.
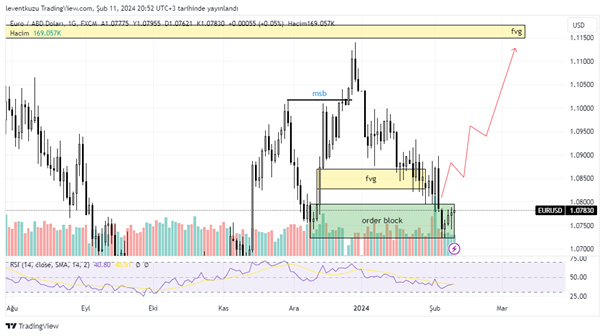
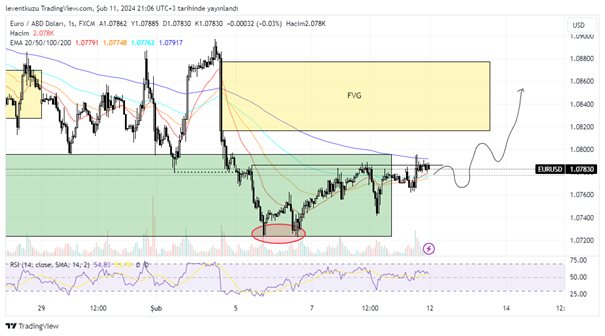
EURUSD
1D analysis
We conducted 4H analysis for HTF. We continue HTF by 1D analysis this week. Price reached the daily order block. A small liquidity was swept and price had four bullish candles. Fair value gap s present where bullish market structure break was formed. Price will follow first the fair value gap and the liquidity just below the extreme liquidity, shown by yellow box unless it losses the yellow box shown by green colour.
1H analysis
Price left a wide fair value gap between the last lower low and lower high. Double bottom was formed within the 1D order block which was mentioned in HTF analysis. Price made an insignificant break of structure. EMA 20/50/100/200 all reached to similar value, which suggests a possible bullish candle. If this is the case, then we will expect the price move that was shown as the path.
** Important Note: Above ideas are not investment advice!**