BTCUSDT
1D analysis
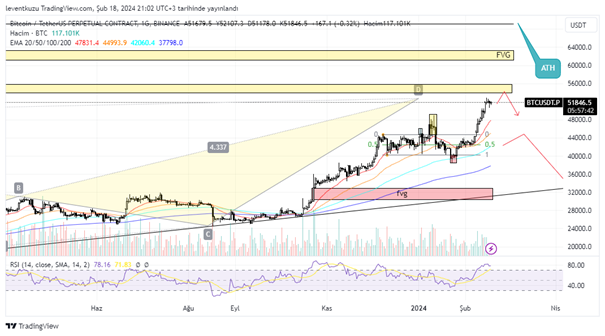
Weekly chart showed the formation of a bearish harmonic formation previously. But we should note that price made a bullish market structure break on the weekly chart. Therefore, this bearish pattern can be just considered as a correction of the bullish move. We should not expect any lower levels than fib 0.618 of the pattern. The price was within a range since early December. It was broken last week and price moved upwards with strong candles. Two fair value gap zones are present on the sell side. One of them is quite close to that level. Although RSI seems to be saturated, it may want to reach the fair value gap zone. $55,000 can be target on the bullish side. Then, we may expect the reversal movement.
1H analysis
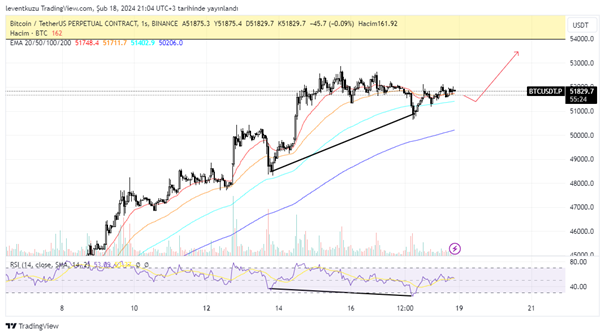
A minor correction attempt was recorded on Saturday but it was not strong enough and shook out some long positions. On the other hand, it did not fully filled the fair value gap. Lower time frame EMAs neither cross each other nor EMA200. Controversially, there is a bullish RSI divergence on 1H chart. The price can continue its movement until the fair value gap above, which is between $54,000 and $56,000.
XAUUSD
4H analysis
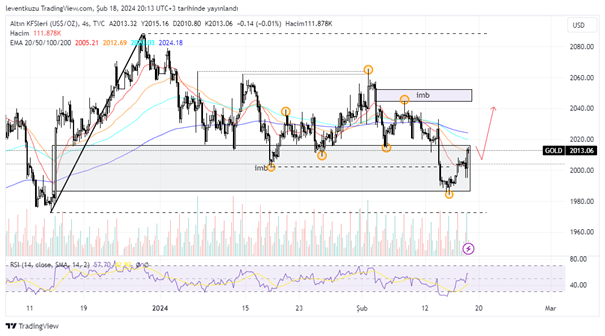
At the previous analyses, we focused on the movement behaviour and driving force for the price movements of gold. Internal liquidities and imbalance zones had significant importance. The extreme dashed lines show the price levels that should be exceeded to make either a break of structure or market structure break. The overall high time frame is bullish on gold. Until the end of 2023, price is within a range and no market structure exists on 4H time frame. Recently, the price swept the major imbalance. The price reversed on lower time frame to bullish structure. As lower time frames are less confidential, we can expect a price move as shown by the red path.
15 min analysis
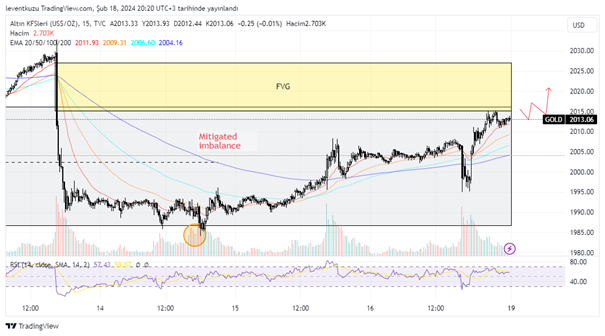
Market moved downwards with a strong momentum. After forming the market structure, turned to bullish. The only indicator of turning to bullish is not just the price candles, EMA20/50/100/200 crossed from bearish to bullish. This is also an important sign of the market shift. Higher time frame imbalance is mitigated and is no more important. At the current time, there is a fair value gap that should be filled, which formed during the last impulsive downward movement.
EURUSD
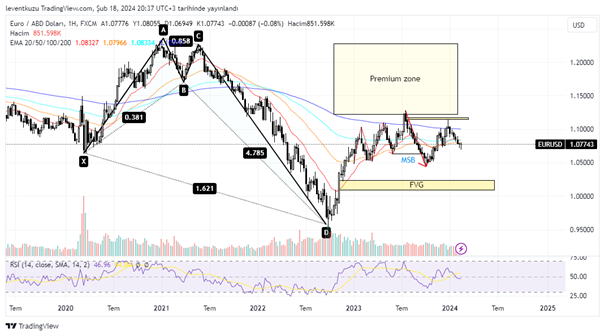
1W analysis
It is sometimes necessary to make higher time frame analysis to reveal the possible target zones, which can serve an interest to the price. On the weekly time frame we realized a harmonic pattern. It reached its target by tapping the premium zone. Price could not find any support to continue its upward movement. It was reversed twice from EMA200 level. On the other hand there is a market structure break on the weekly chart. The price pattern is nearly completing a Quasimodo pattern. After its formation, definitely, the below fair value gap around 1.02 pair price will be the target.
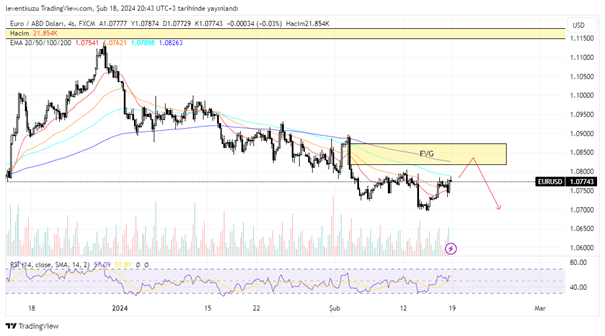
4H analysis
The apparent structure on 4H is bearish since it has closed candles several times under some swing low points. Low number of EMAs crossed high number of exponential moving averages on bearish side. Price left a fair value gap above. Therefore, it may want to reach that point and then continue its downward movement.
** Important Note: Above ideas are not investment advice!**