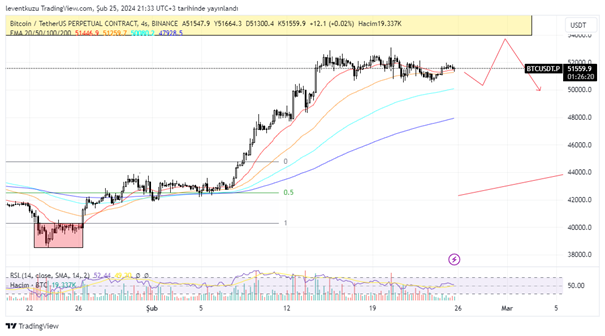
BTCUSDT
4H analysis
After the break of the range, we experienced a sharp increase of BTC. Price is again within a small range. RSI on 4H is losing momentum. We may see some bearish candles that facilitate the RSI to reach the border of over-sold region. In this case, EMA 200 can act as a support. But it can be used as a long entry region. There is still some space to go long until $54,000s. But we should remember that we are in the premium zone on HTF. Long positions are suitable just with scalp positions.
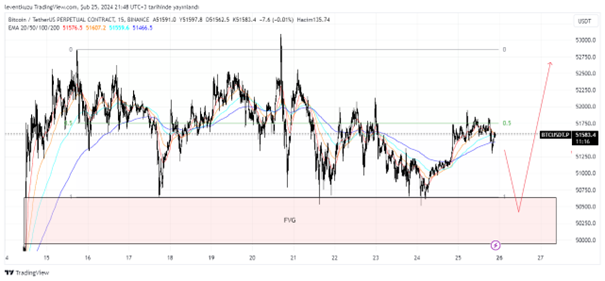
15 min analysis
Pre-mentioned is given below on 15 min chart. There is a fair value gap zone under the range. That zone is a good point for the price to make some deviation. After making the deviation, if price come back into the range, it will possibly target first equilibrium and then range high.
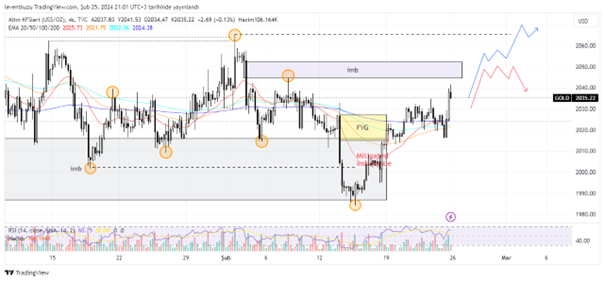
XAUUSD
4H analysis
Price of gold moved towards to the 4H imbalance zone and came quite close to fill it. However, the momentum of last week was no enough to close the gap. There is still same interest to move higher. $2,050 will be important. On HTF, market structure is bullish. But for the current time frame, it is best to decide according to the price in LTF market structure. Because imbalance zone is a good short entry point for the bearish 4H structure.
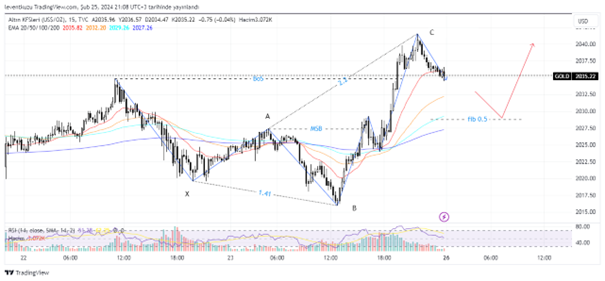
15 min analysis
On 15 min chart, gold is bullish. Market structure was broken to be on bullish side and price made a break of structure, which shows the continuation of the current structure. During these movements, a bullish 5-0 pattern was formed. Now the price can make a retracement until fib 0.5 level of B-C leg. It also coincides with EMA 200 level $2,030 is a good place to take long position.
EURUSD
4H analysis
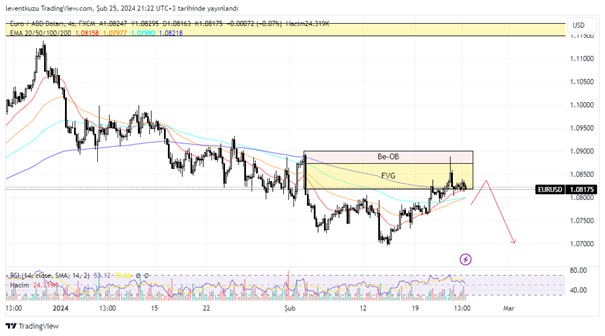
The appearance of the last week worked quite well. Price filled the fair value gap and reversed from bearish order block. Higher time frame suggests 1.02 pair price and a bearish Quasimodo pattern is near to be formed. On the 4H chart, we may target 1.07 pair price as the initial target.
15 min analysis
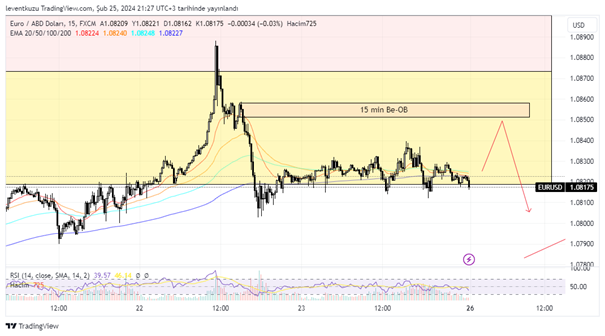
Market structure shifted to bearish on 15 min chart by a series of bearish candles. The start of the movement generated a bearish order block. Although there is not a clear fair value gap in the current time frame, there is a possibility that price can reach to the order block. It can be a smart entry zone.
** Important Note: Above ideas are not investment advice!**