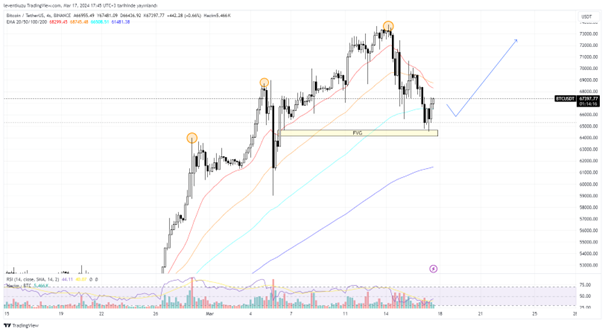
BTCUSDT
4H analysis
We were curious last week about the RSI divergence on multiple time frames. The outcome the price is as we expected. The price touched FVG zone below and on 4H time frame, there is no more divergence. Some liquidities were taken and this downward movement removed the divergence. Now we can expect bullish price movement since there is no bearish market structure break.
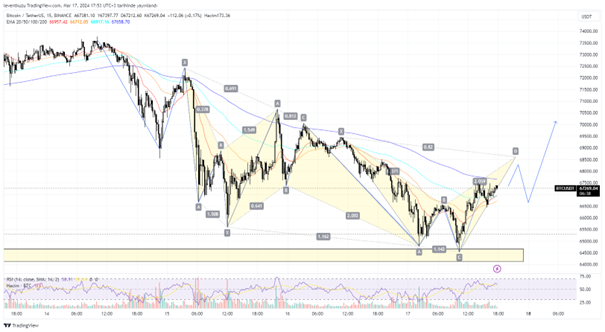
15 min analysis
Price is exhibiting several harmonic patterns on 15 min chart. As of the last pattern, we may search a reversal after leg D. Once retracement has been completed, we should focus on a bullish market structure break. Since, earlier market structure breaks did not shift the structure of the market. They remained as inducement. Another critical issue is EMA200 line. Once it is broken upwards with a retest, BTC can move to higher prices.
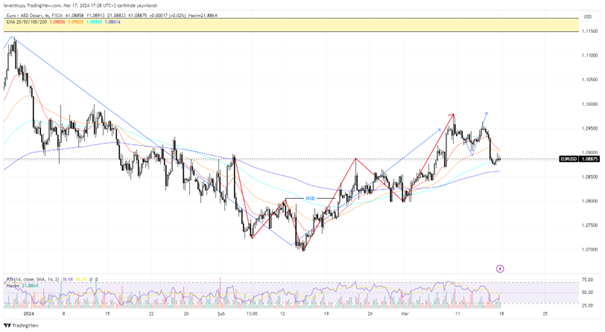
EURUSD
4H analysis
Price of EURUSD pair moved in accordance with our expectation on last week. A market structure break occurred previously. The price is on a bullish trend on 4H. It seems that EMA100 held the pair price and retracement leg has nearly completed. The yellow area above was the target on the daily chart that was shown last week. It is a fair value gap zone and we may see the price moving towards that area.
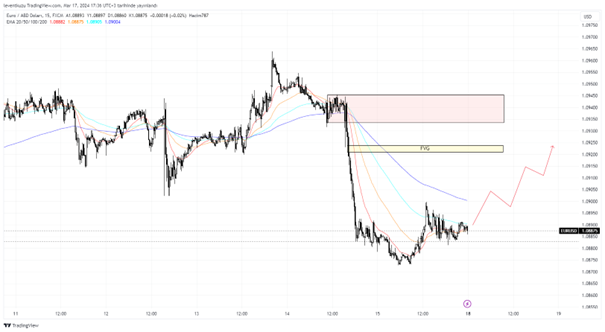
15 min analysis
Price went down with huge momentum on 15 min chart. The downward movement was nearly balanced. Only a small fair value gap was left that was shown by yellow colour on the chart. The area with red colour can be deemed as an order block. Price remained there for some time and went fast with several bearish candles. The only thing that should be considered is that there relatively low FVG. The will probably go up and pass through the FVG. The critical zone is the red area. We should watch the case within the area for building new positions.
XAUUSD
4H analysis
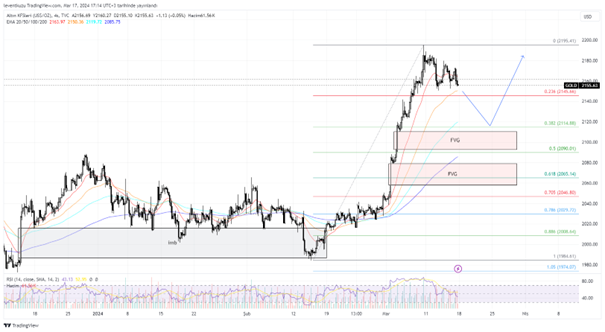
Price of gold went up nearly $2,200s with huge momentum from early March. Price was in a rest on the last week. We may expect some fluctuations on the price. The first fair value gap is a good target for the price to make a retracement. It lays between Fibonacci 0.382 and 0.5. A second fair value gap is located below, which crosses Fibonacci 0.618. Therefore, these two values are good prices to build long positions. The critical values are between $2,110 and $2,060.
15 min analysis
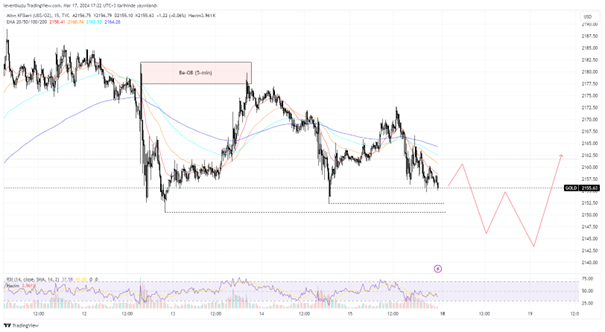
Although the price is bullish on higher time frame, it is bearish on 15 min chart. There was a strong downward movement creating an order block. But the block was relatively too wide. That’s why it is identified in 5 min chart and shown on 15 min chart. The price reversed from the order block. Now the possible target is the close open two liquidities. Price may want to reach there and after some more lower prices, we may expect a market structure break for a long position.
** Important Note: Above ideas are not investment advice!**