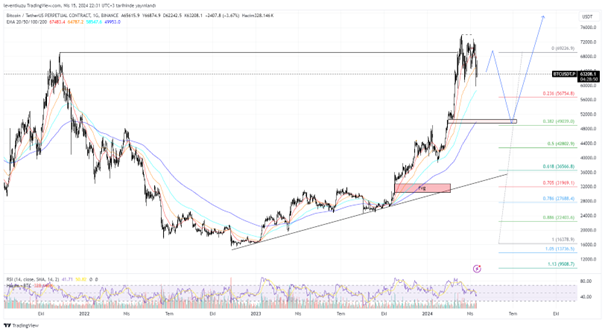
BTCUSDT
1D analysis
A speculative movement occurred at the weekend in the price of BTC due to recent news. I want to re-express my ideas from the daily chart. Since some movements make sense according to HTF. After reaching the ATH, price had some attempts to cross $74k, however, it was failed. After that, price started to make movements as shown on the blue path, which was drawn earlier. Although $49k is a possible retracement zone, I don’t expect a such deep correction in the current market sentiment. $59k seems to be the most likely ultimate retracement zone and price will move upwards unless there is a negative news.
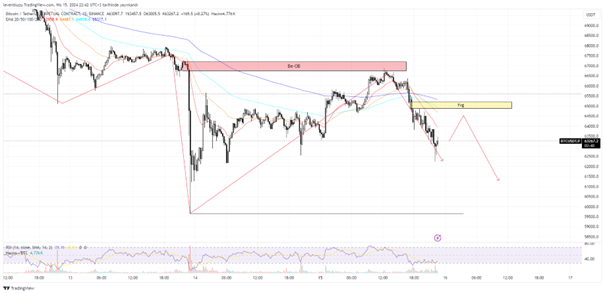
15 min analysis
The market structure is bearish on 15 minute chart. Price has a downward movement with high momentum. The price closed the fair value gap occurred during this movement. Then, price retraced from the bearish order block. Bullish RSI divergence is due to happen on the current time frame. Price will possibly reach to the fair value gap zone. The reaction from that zone should be observed. If this level is lost, then short positions can be taken until the last swing low.
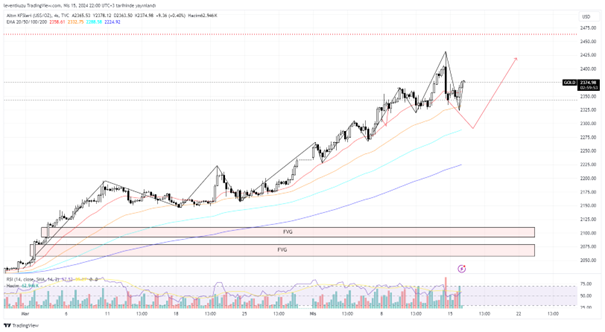
XAUUSD
4H analysis
Speculations of a possible war has been effective in determining the price of gold. Since such news pushes the price of gold higher, the same issue happened. As the expectation has extinct, a strong upward movement was observed and then, the movement turned back. The price is still in a bullish structure. Any negative case in not available yet. EMA50 has held the price on the last retracement. There is no shift in the market structure. Last swing high is the possible target.
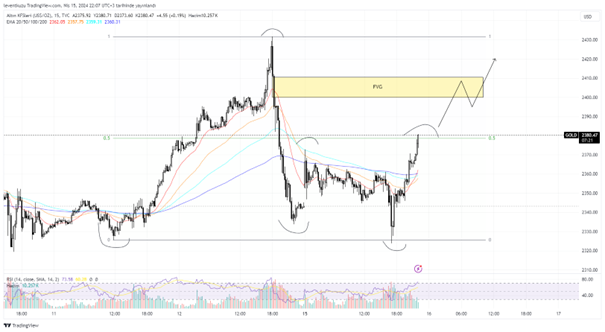
15 min analysis
Since the last impulsive move, we can observe the formation of a range. Price retested the range low and formed a small deviation, which can be considered as a liquidity hunt. Then continued its upward movement. Equilibrium of the price has been past recently. The possible target is the fair value gap above. After reacting from there, price can target the high level of the range.
EURUSD
4Hanalysis
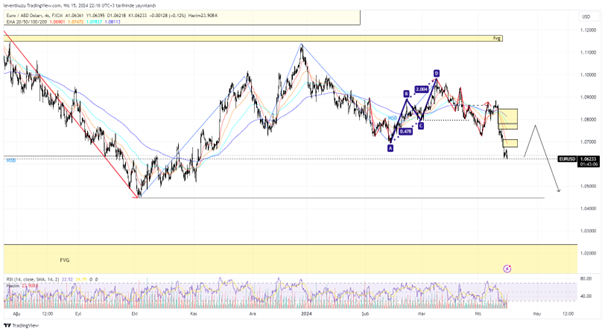
As it was commented earlier, the loss of 1.07 would bring the bearish market structure shift. This happened and now the structure turned to bearish mode. On the extreme time frame, 1.044 seems as the target. Price left many imbalances at the 4H chart. Price will possible retrace that zones and then, move to swing low location, shown with the solid black line.
15 min analysis
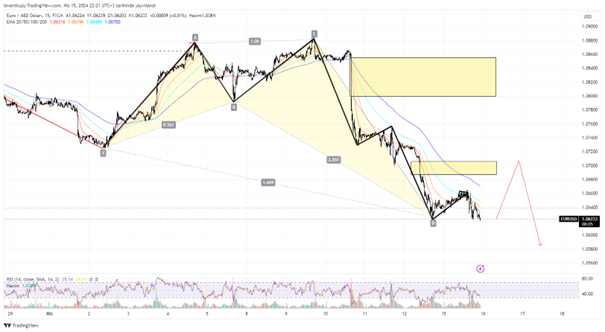
15min chart is bearish in terms of market structure. X-A was the last impulsive leg. C-D took the liquidity and the price drop continued until fib 1.618. This price level is a possible retracement location. Bullish RSI divergence is available as a different indicator. The closest fvg zone will be the nearest target. If some more retracement happens towards the premium zone, the higher fvg zone will be the target. Then, price can move to lower levels.
** Important Note: Above ideas are not investment advice!**