BTCUSDT
4H analysis
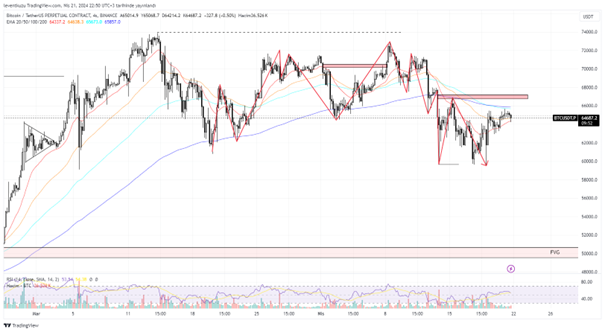
4H market structure is bearish and also price is now under EMA200. These both shows that if there is a bullish market structure break on lower time frames, these can be considered as just corrections and will not make it available to close candle on the last swing high point. $67k is a critical point, which has to be tested to fill an order block. After reaching there, strong downward price movement is possible.
15 min analysis
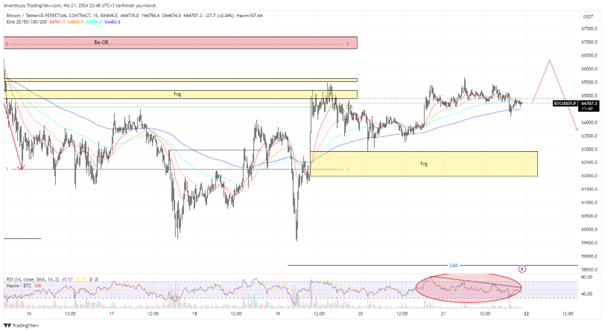
Monday range of the last week is still in play. Price made just some deviations. It filled one of the fair value gaps above the equilibrium price level. But there is one more remaining FVG. O the other hand, a bearish order block is available. The decrease in RSI is suspicious. Price can first fill the fair value gap below. Price should be watched carefully.
XAUUSD
4H analysis
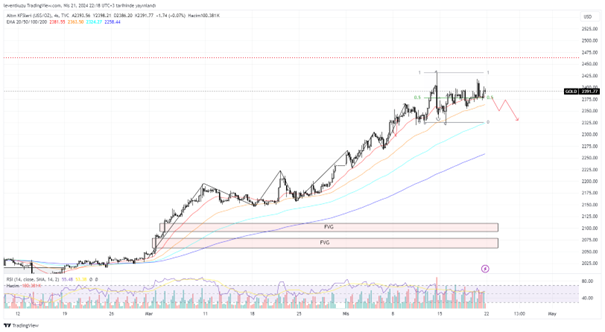
While there is an obvious uptrend of the 4H chart of gold, there is a momentum loss since the last week in the price of gold. On 15 min chart, a range formation is clear. However, in the current time frame, bullish structure is still in play. If there is an accumulation of the price after a bullish movement, two sided price movements are possible. In this example as a momentum decrease of RSI is available, a decrease on the price can be expected. However, this alone is not a significant indicator. We should focus on short term confirmations.
15 min analysis
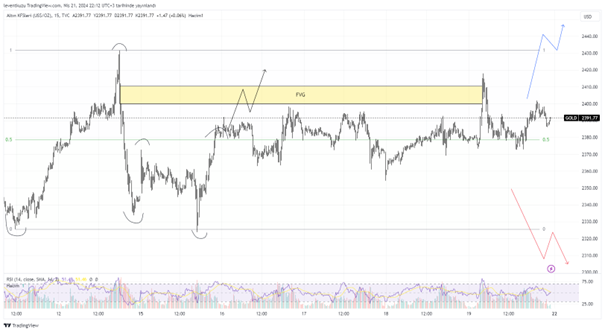
The range drawn last week is still valid. The price is around the equilibrium of the range. It just moved away from the equilibrium to fill the fair value gap. The weekly price difference is only 2-3%. The break of range low or range high will be a choice for making entry to either short or long positions. If range low is broken, short position can be taken after retest of the RL. On the other hand, long can be taken after the price breaks range high, closes candle over that value and tests the RH price level.
EURUSD
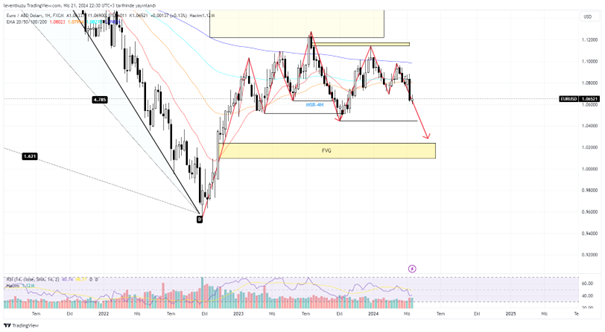
1W analysis
It is the first step in several times to watch high time frame analysis in order to understand the current state of the price. There were some minor bullish reversals although multiple time frame charts are bearish. When heikin ashi candles are used, we can observe recent bearish candles. Price made a market structure break on the current time frame. It made its correction and still pending to go lower pair price level. 1.02 is a reasonable target.
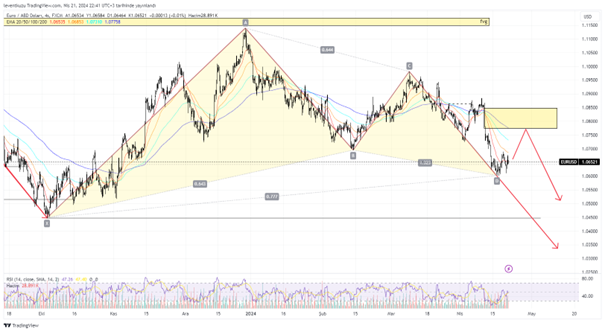
4H analysis
Since there is a bullish Gartley-like harmonic pattern, price can gain some value. If this happens, the target will be the fair value gap. In this case, price will go up until 1.08, then there will be a drop until 1.045.
** Important Note: Above ideas are not investment advice!**