BTCUSDT
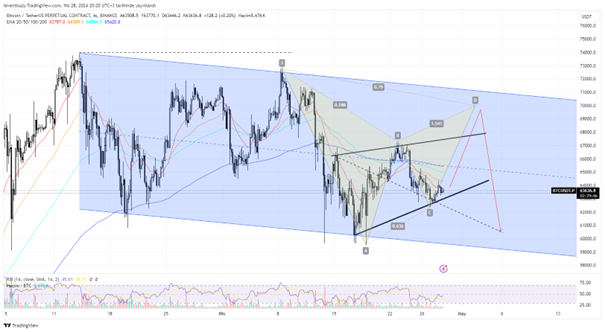
4H analysis
Price of BTC is within a descending channel since the last two weeks. The high and low points of the channel worked well for a reaction. Now there are two possible formations that can be completed. One is a bearish Gartley pattern. The other one is a Wolfe pattern. It seems that they will work properly if the price reaches $70k level. After that price reversal will be possible down to $60k level. According to break of the channel increase or decrease of the price can happen sharply but it is now too early to comment on this price movement.
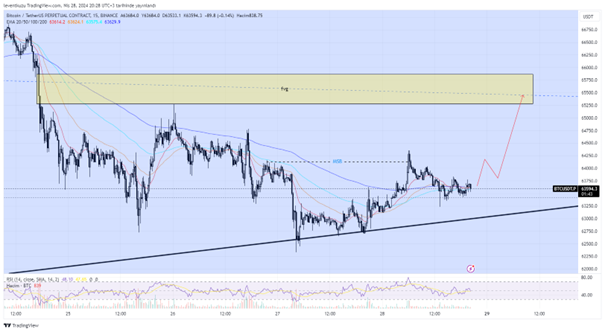
15 min analysis
The lower time frame analysis of the last week was 4H chart and we expected the price to move down to $62.5k to fill the imbalance. It is partly completed and on 15 minute chart we can observe a market structure break. Since 15 min. MSBs can be erroneous signs, HTF chart also supports a possible price increase. additionally, different EMA averages are about to change to increasing side. Therefore, we are assuming a reversal on lower time frame. The fair value gap around $65.5k will be the target according to this chart.
XAUUSD
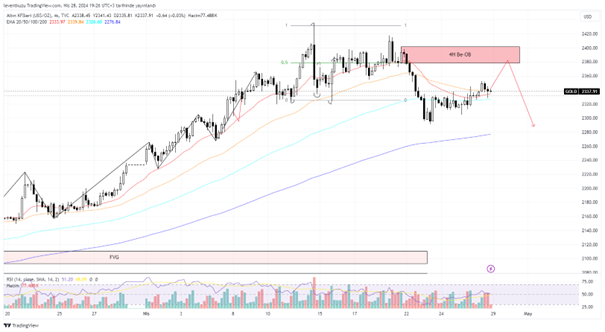
4H analysis
We mentioned about a momentum loss in the price of gold last week. Therefore, we showed the price within a range. Ranges always have two possibilities but the probability of gold price movement was closer to bearish side. Indeed, range low was broken and several candles were closed under this value on 4H chart. This additionally made a market structure break. The series of bearish candles generated an order block. On the current time frame, the order block seems to be a suitable place for sell positions or to build short positions.
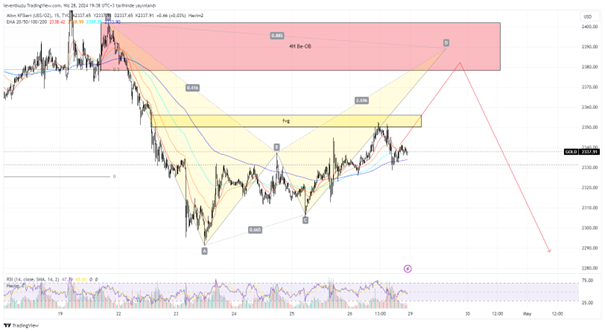
15 min analysis
Although the price is bearish on 4H chart, it is bullish on 15 min chart. A fair value gap is present on 15 minute chart and price tapped there. Some of the gap was closed. Price reacted from FVG to EMA200. Now it can move towards the order block passing through the fair value gap. There is a possible bearish bat pattern. If this pattern occurs, The price will react within the 4H bearish order block and then we may expect lower prices. The best place for a short position can be opened after observing an RSI divergence.
EURUSD
4H analysis
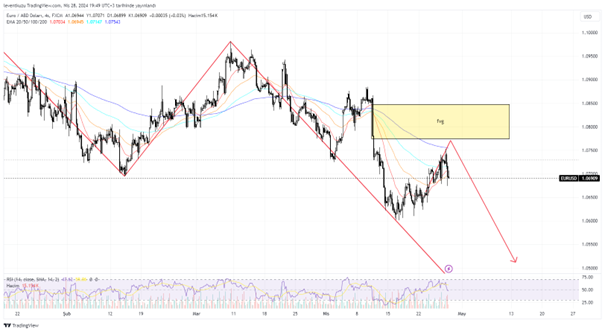
The comments of last week was based on a weekly chart and 4H chart. Higher time frame market structure was bearish. The expectation was to fill the fair value gap available on 4H chart. Now the price is quite close to the fair value gap. Bearish continuation can be expected within the fair value gap zone. However, previously a Gartley pattern was shown on the chart (you can check out the chart of the last week). Therefore, price may go beyond FVG zone until 1.09 pair price. Short positions can be available after a bearish divergence.
15 min analysis
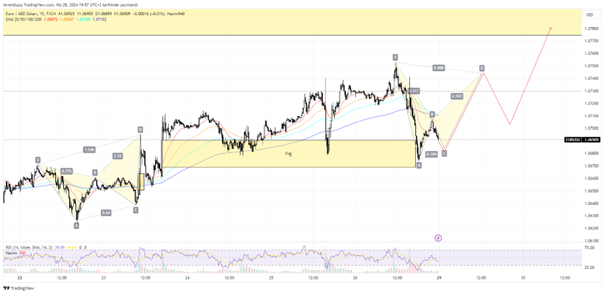
The chart is on a bullish structure on the current time frame. Within the current screen, we observed formation of two different fair value gaps. They were filled partly by the price candles. The recent price chart can depict a bearish bat pattern. After that a retracement can occur until 0.618 Fibonacci level of the price and then continue to bullish move until the fair value gap available above, which was also shown on 4H chart. The probable price path is shown by a red colour line.
** Important Note: Above ideas are not investment advice!**