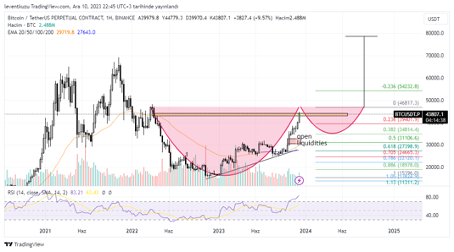
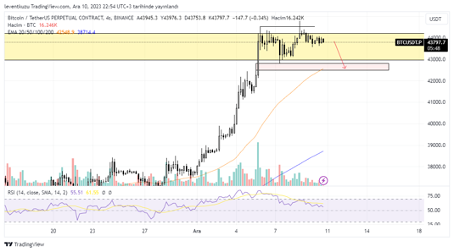
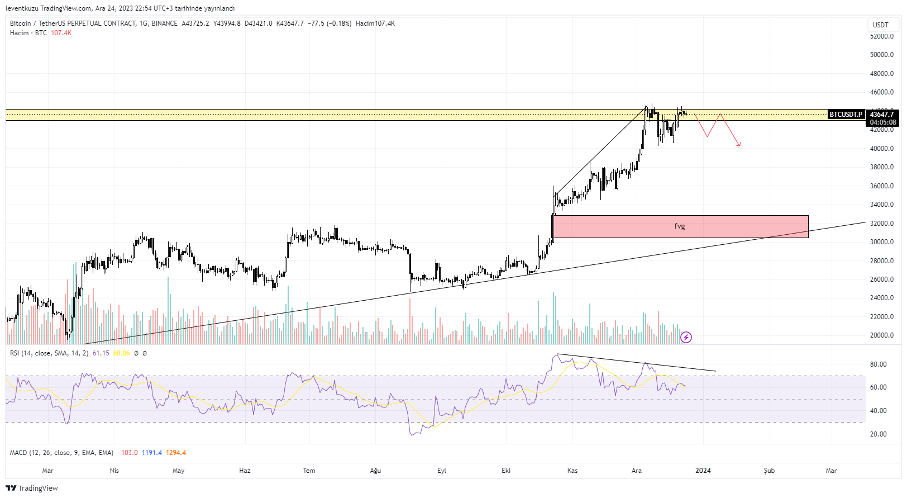
BTCUSDT
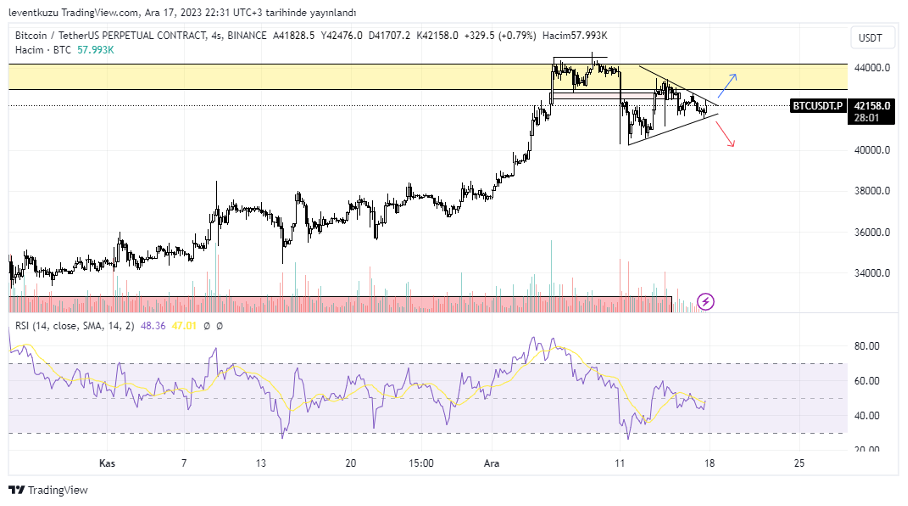
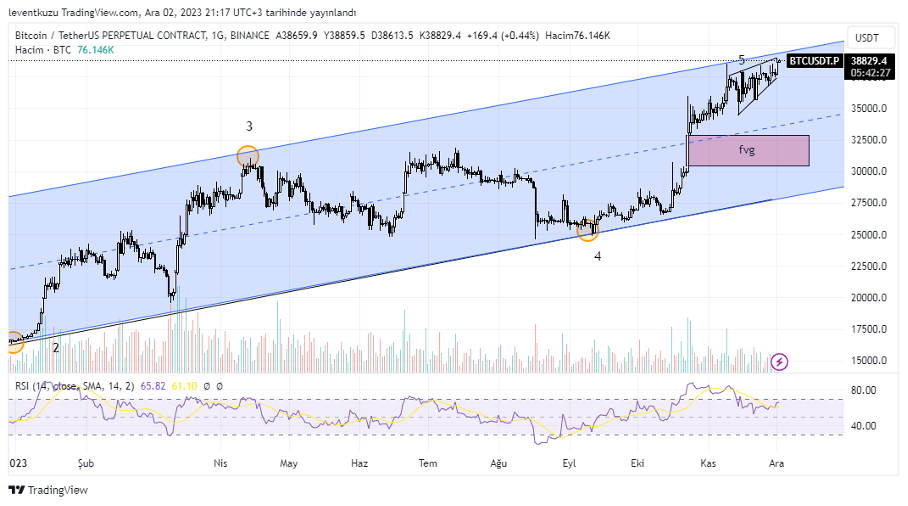
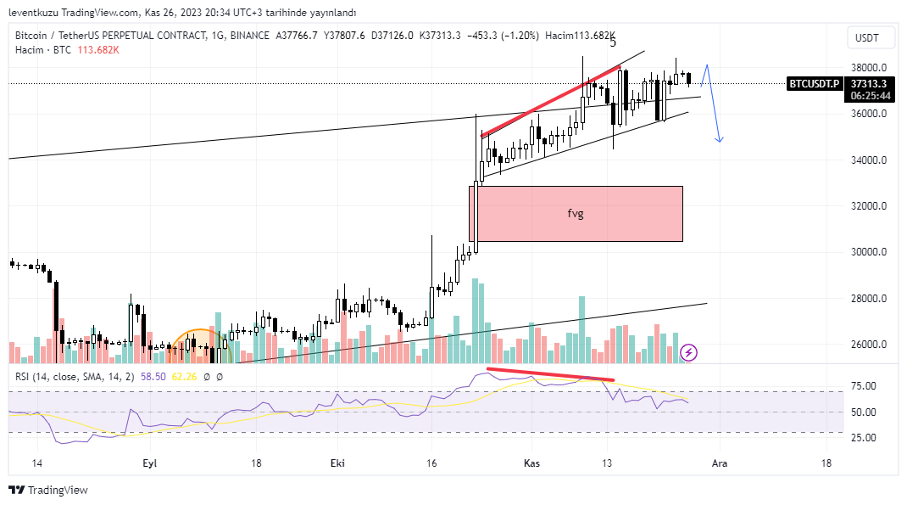
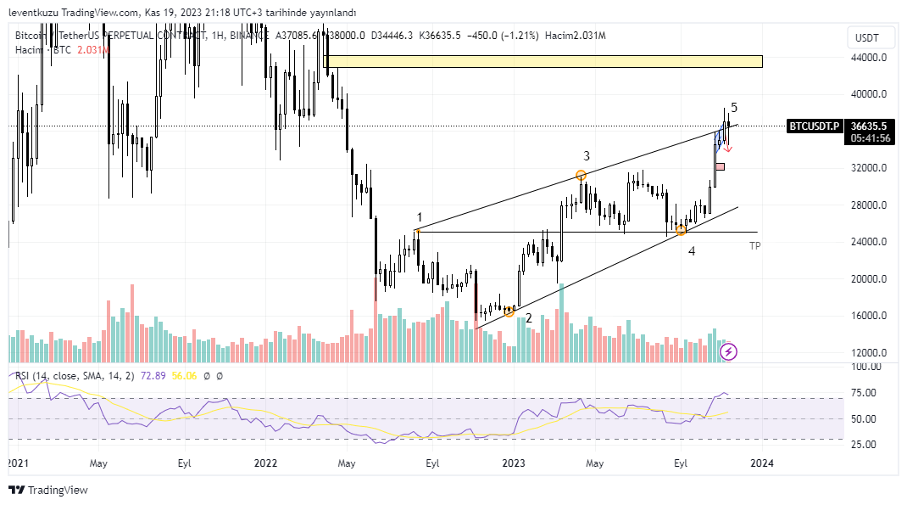
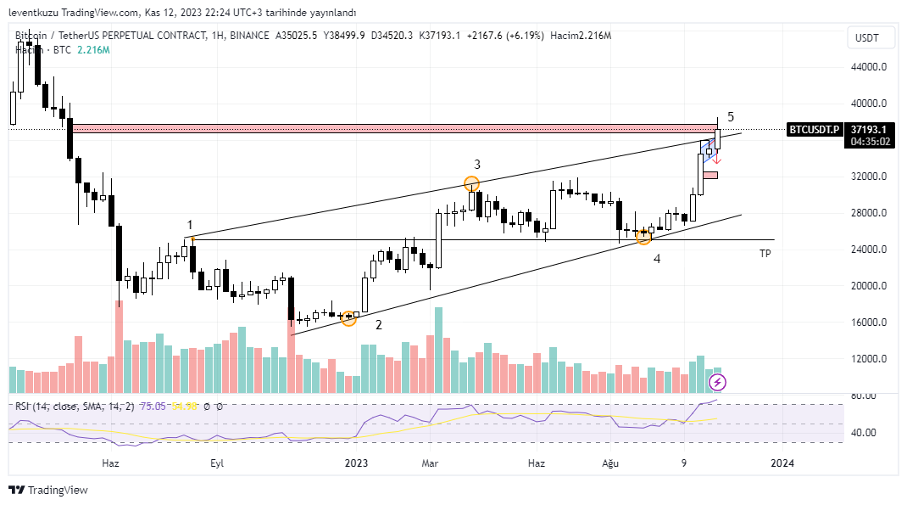
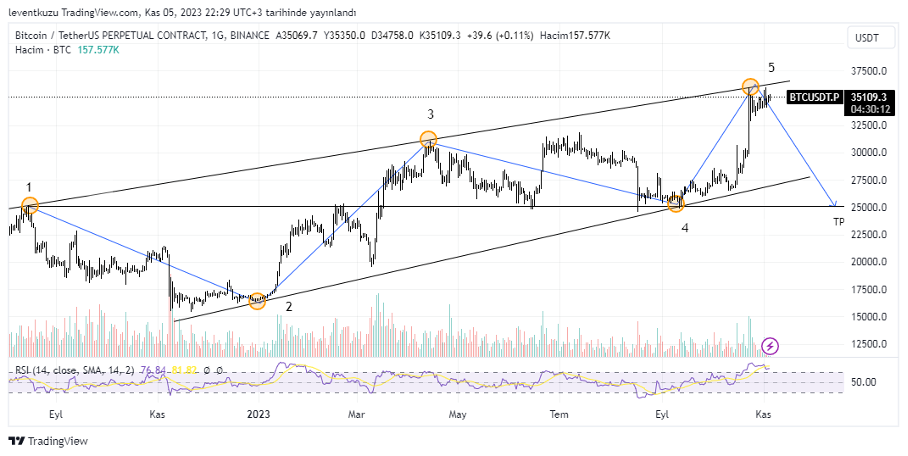
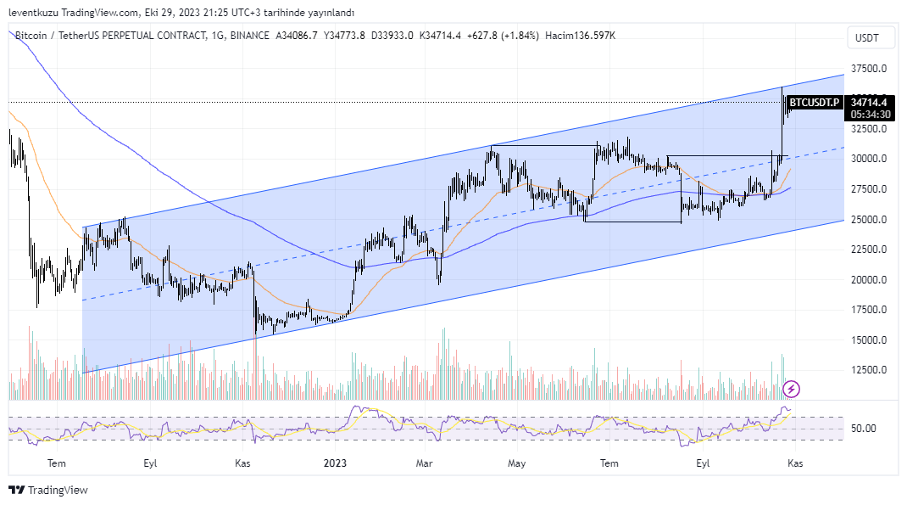
1D analysis
The pre-drawn yellow box is a point of interest on weekly chart. the price could not ultimately move above that value. we observe a shrinking RSI for several weeks on the daily chart. If we consider the weekly chart, RSI is quietly saturated. We may observe some correction from the current price. This may be due to the loss of BTC dominance. If this is the case, we will see some altcoin pumps at the same time. Another alarming sign is the USDT dominance. On the daily chart, there is bullish RSI divergence. Dominance is around 5.58% currently. Correction can be until 7.2%. If this scenario happens, then the pre-drawn FVG can be the target.
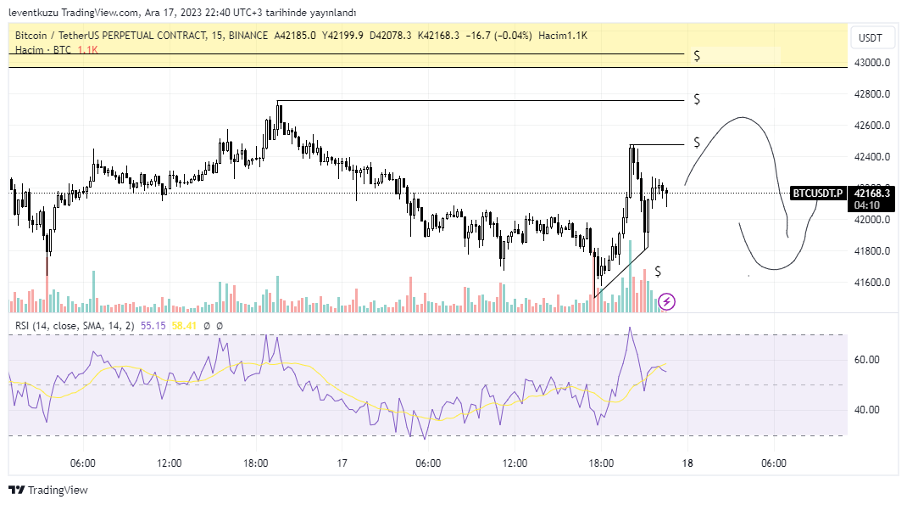
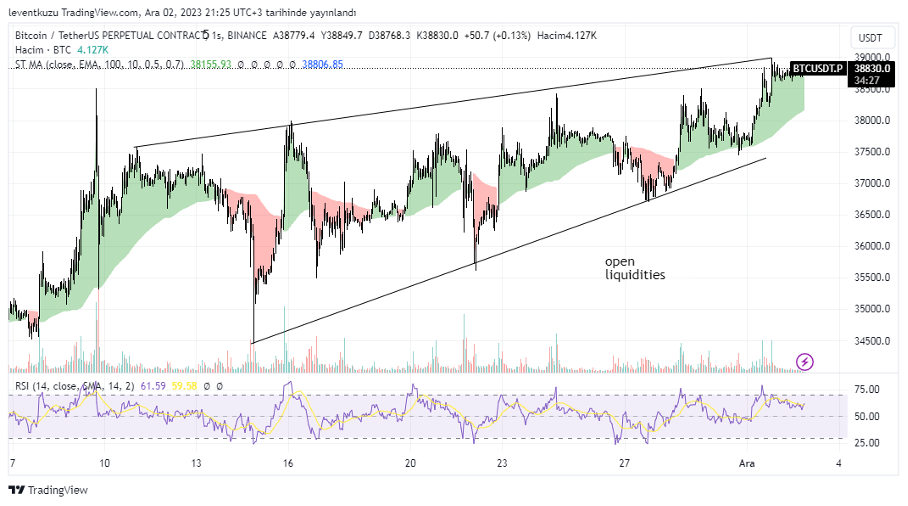
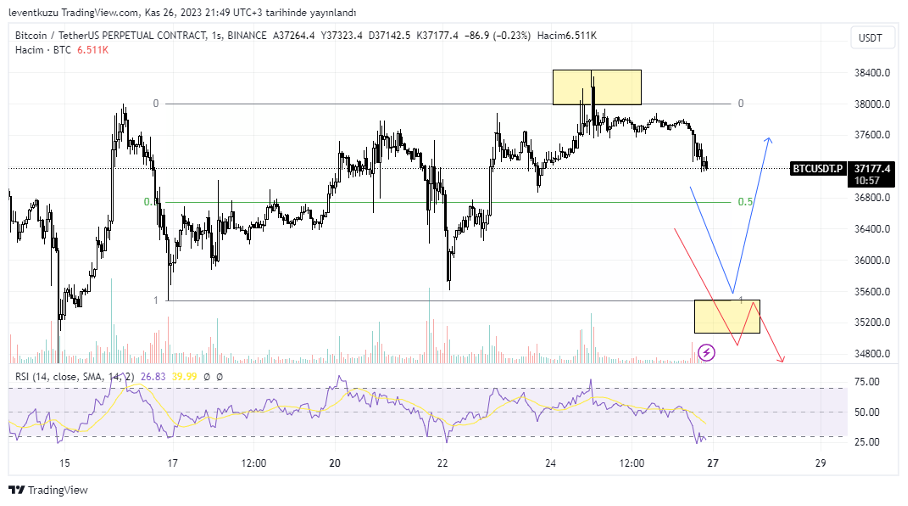
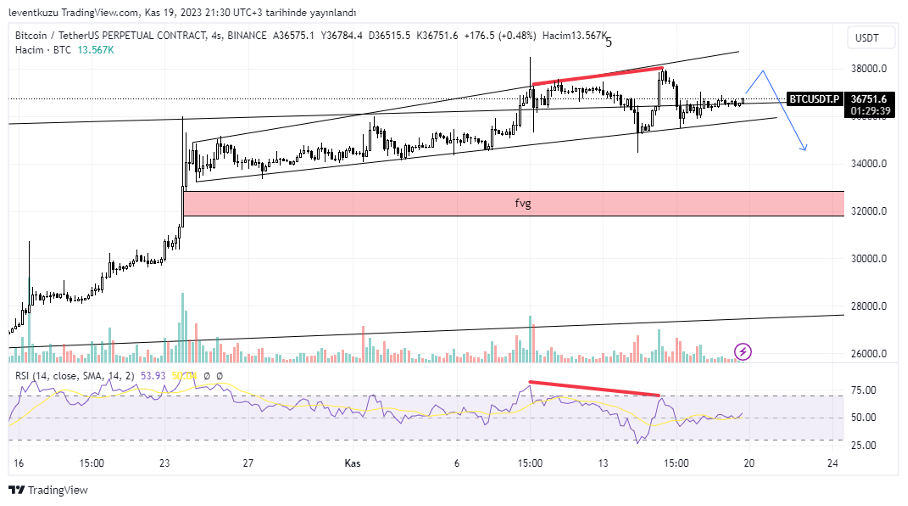
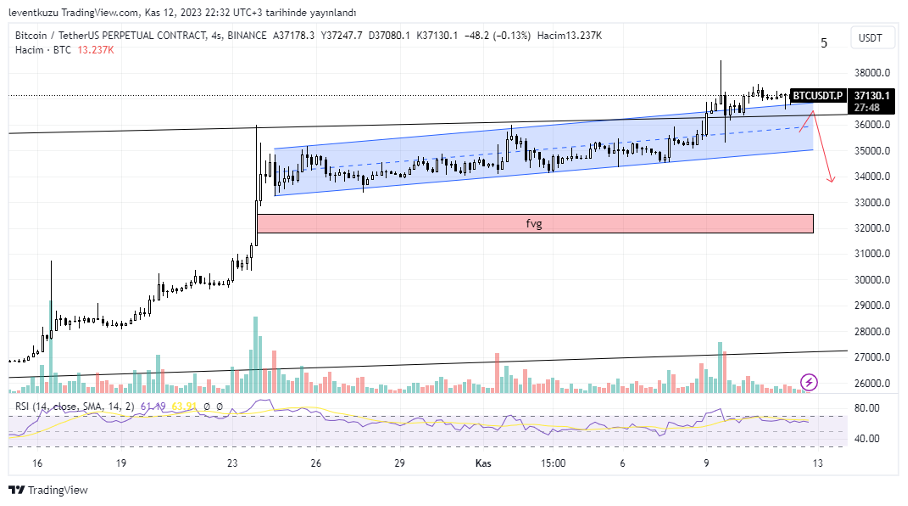
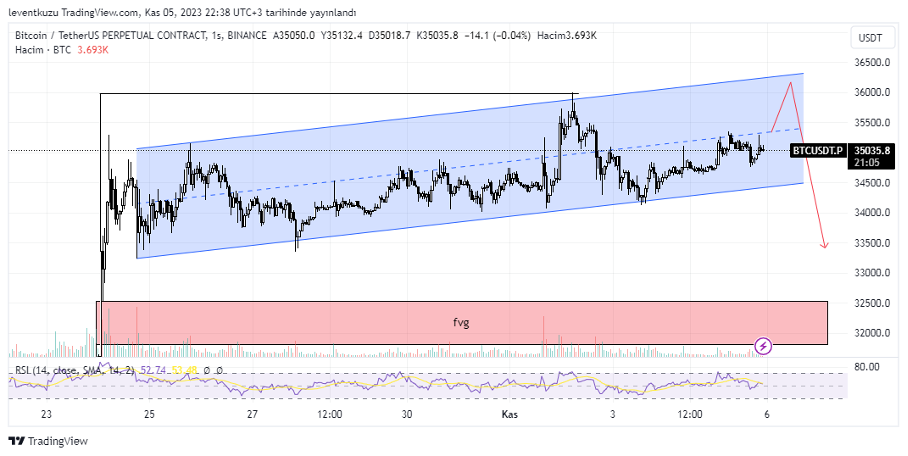
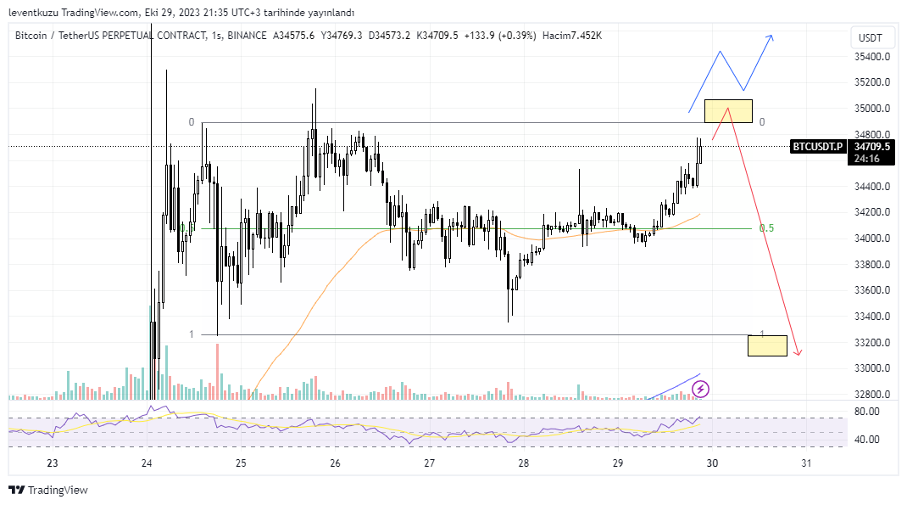
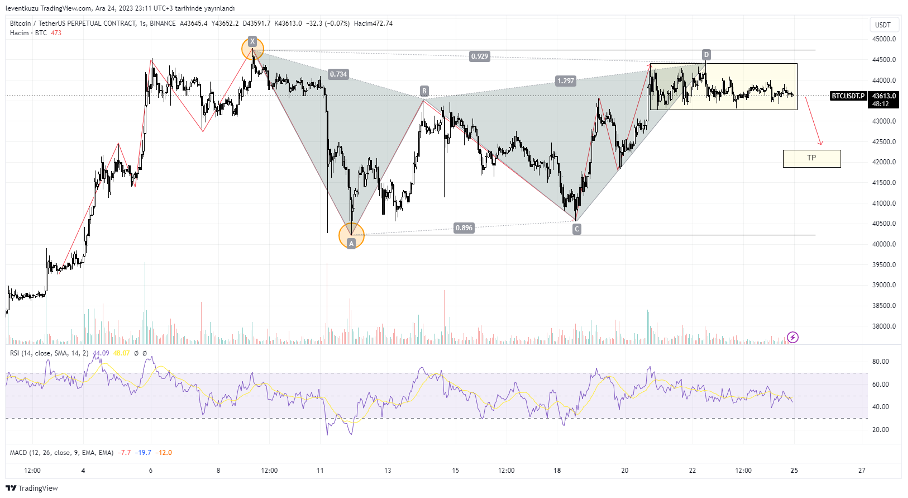
1H analysis
Although the price was bullish on the hourly chart, a severe correction was realized and a change of character was present for the current time frame. The price is still within the corrective leg, where the swing points are shown with the circles. the current price move generated a bearish harmonic formation. If the last rang, shown by yellow box, is broken downwards, $42,000s can be the target of 1H chart.
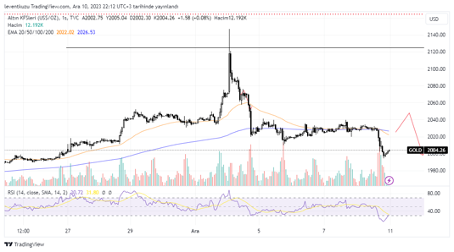
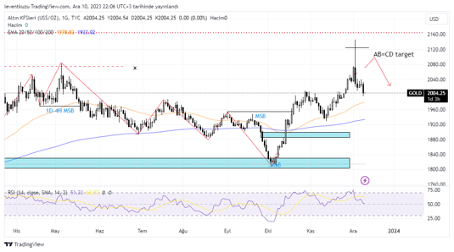
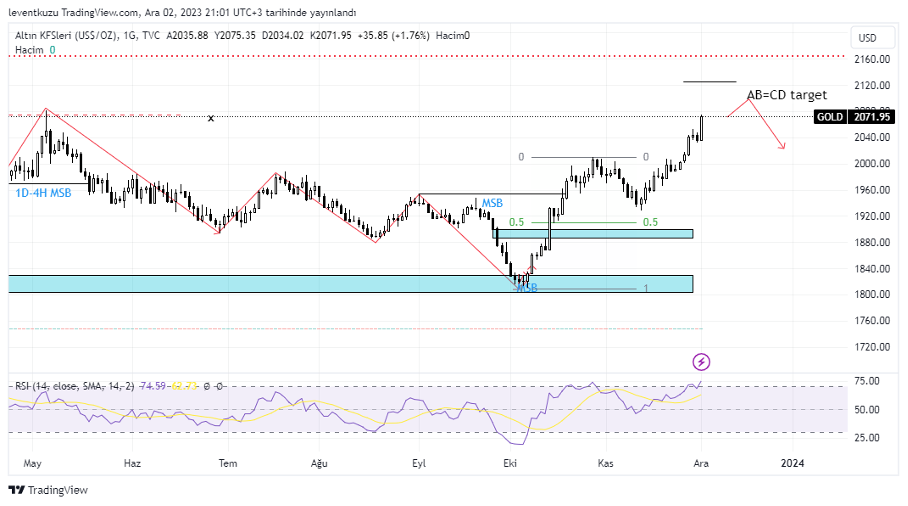
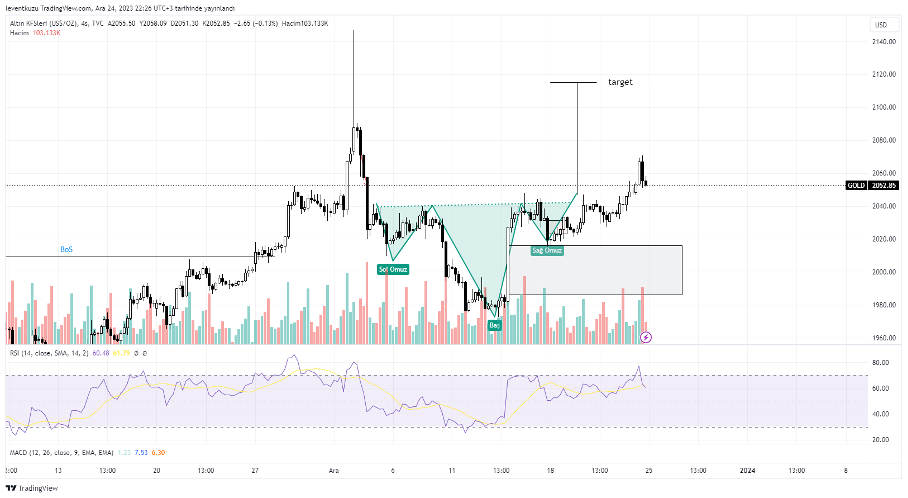
XAUUSD
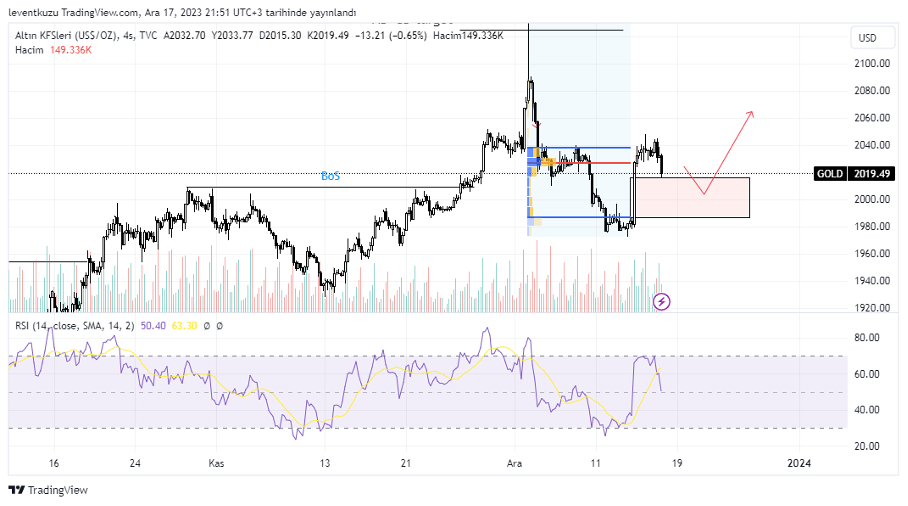
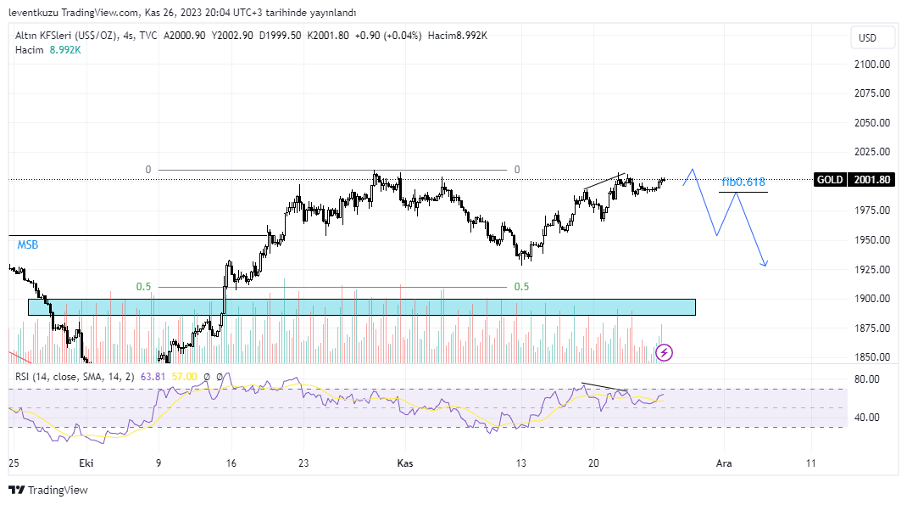
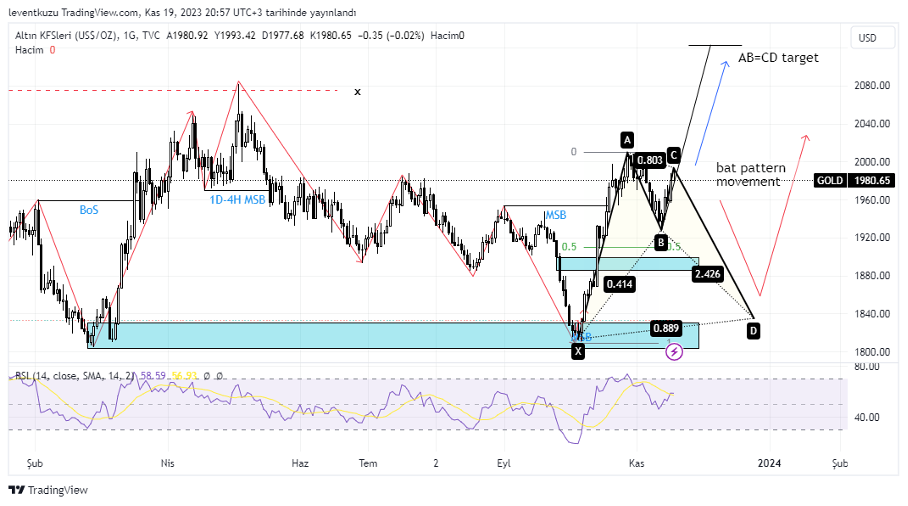
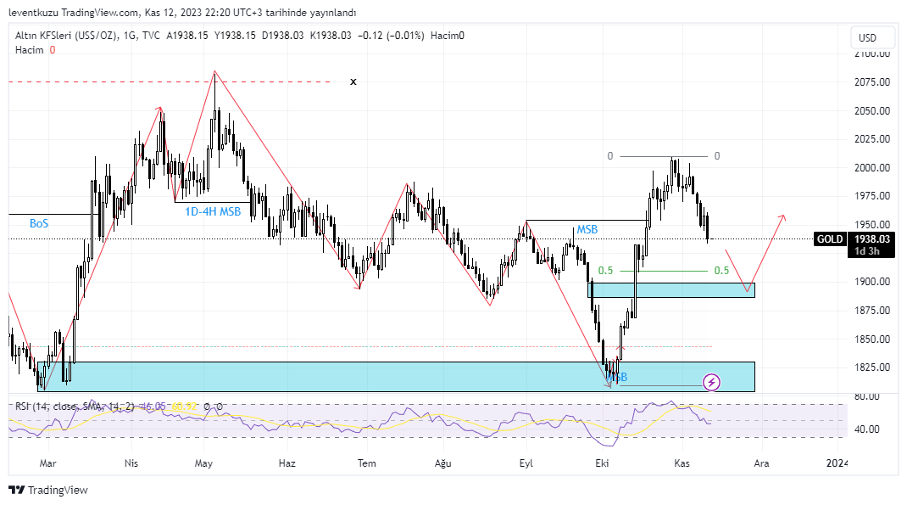
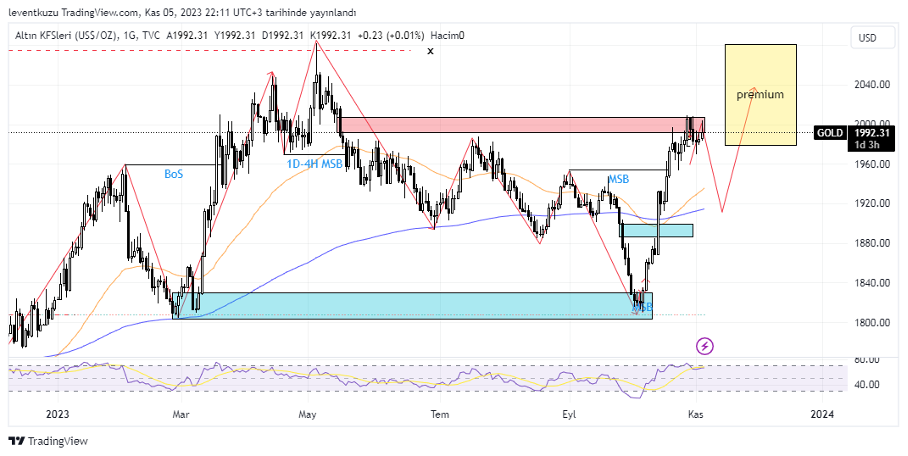
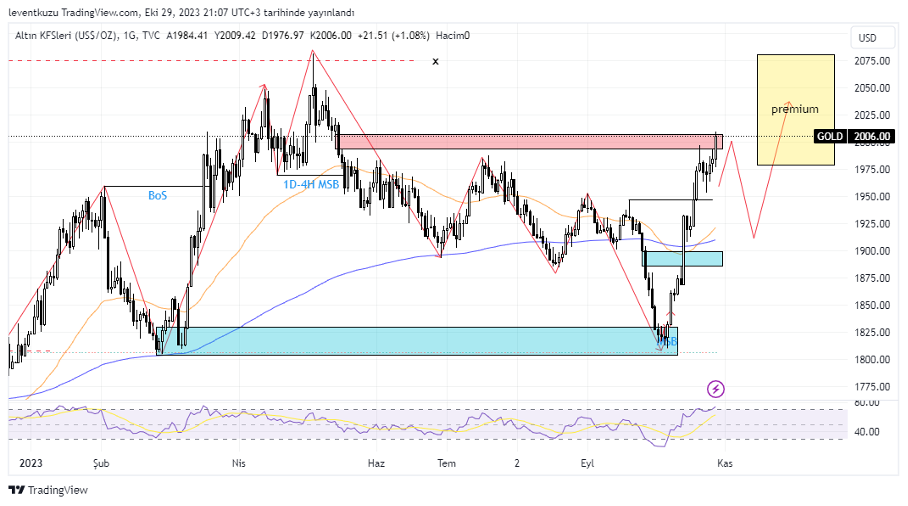
4H analysis
According to the analysis of last week, we expected the price to fill the FVG, which is shown by light gray colour on the chart. The price was unable to go lower values. We can now observe an inverted shoulder-head-shoulder formation. the target for this formation will be $2,100s. After the reach of the price to the target, we may then look for a possible move to the FVG zone below.
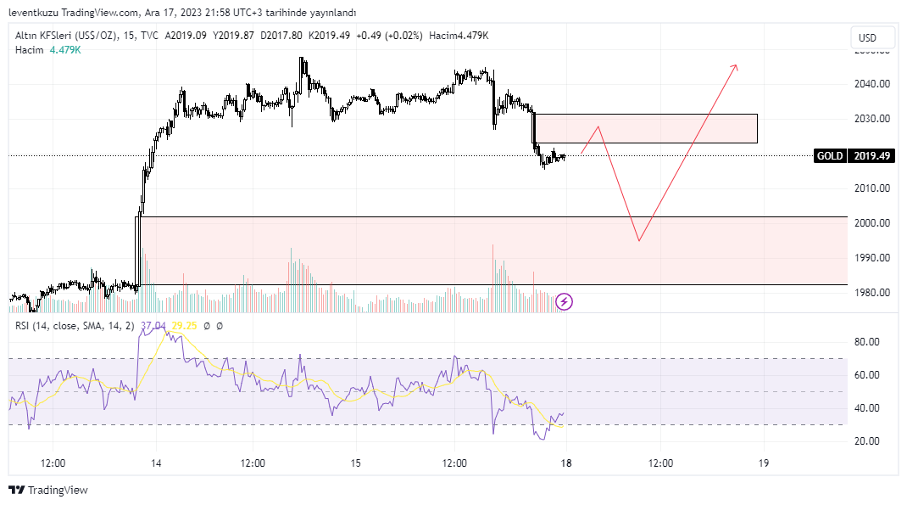
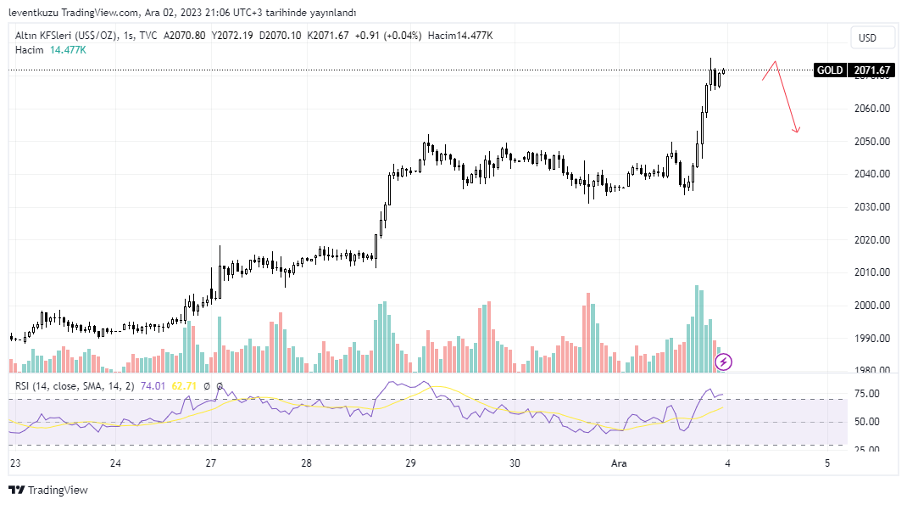
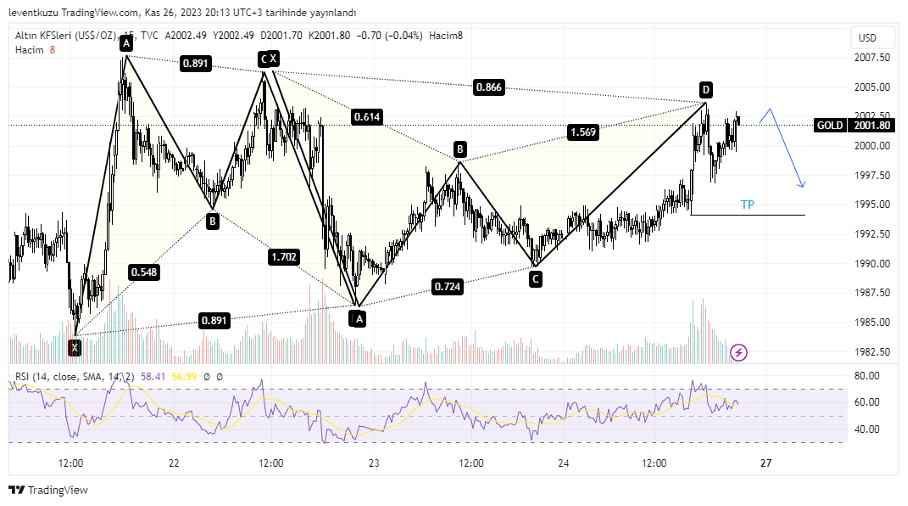
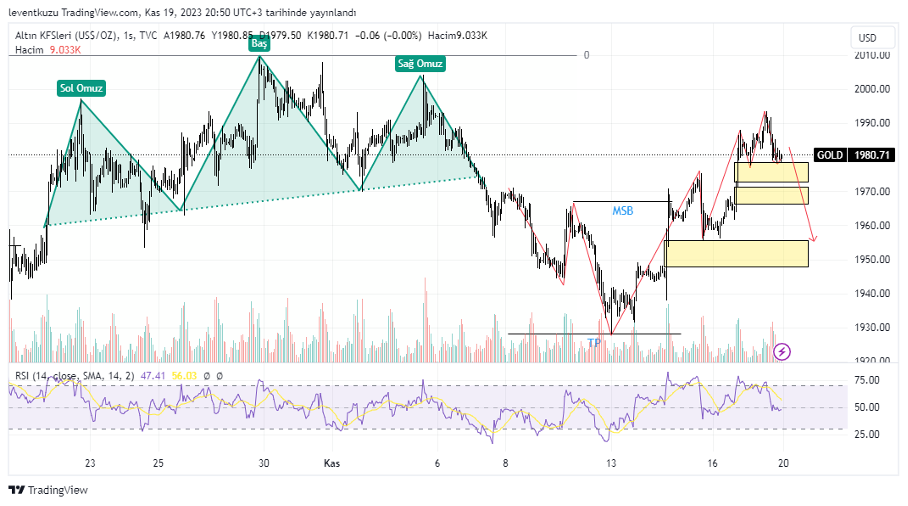
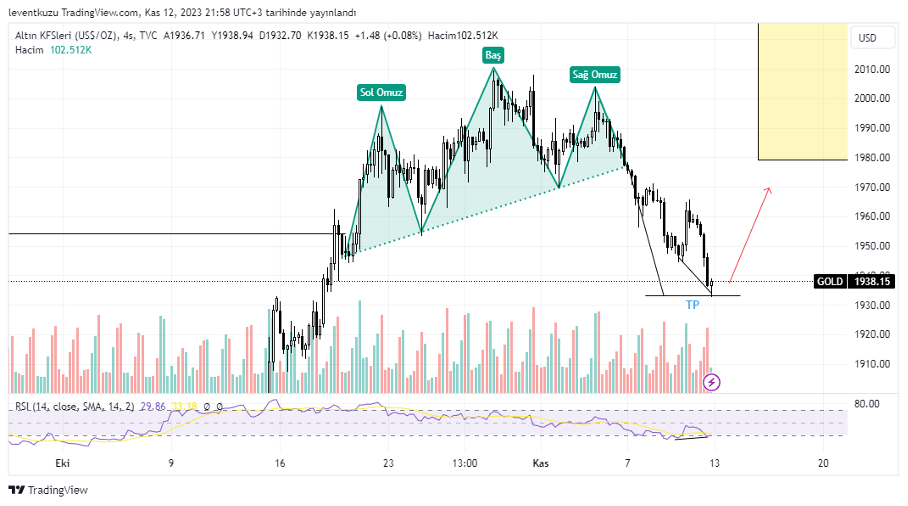
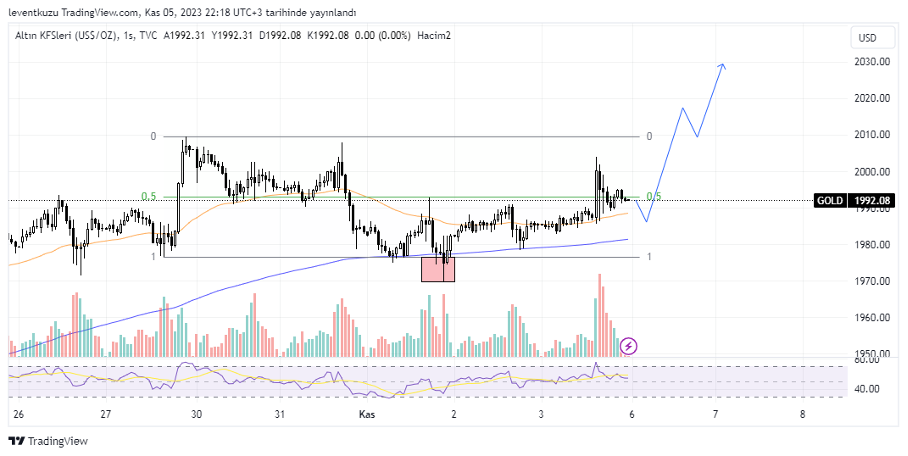
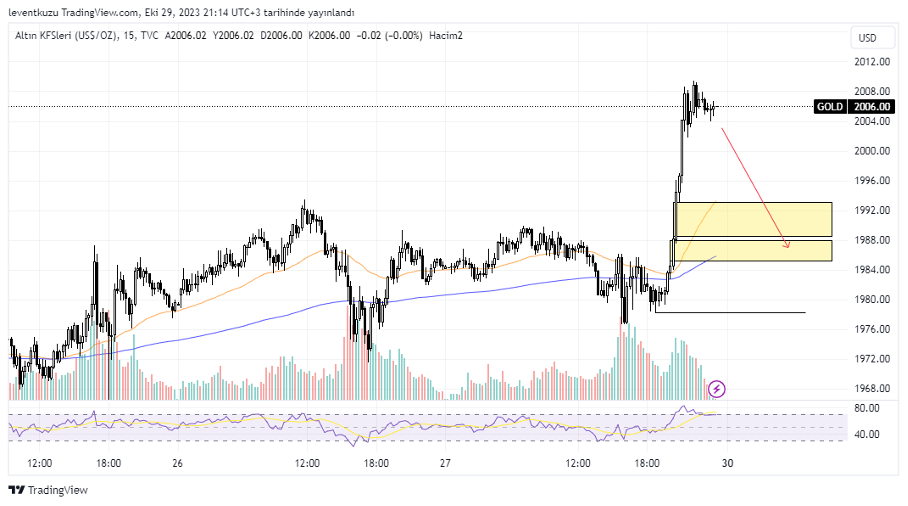
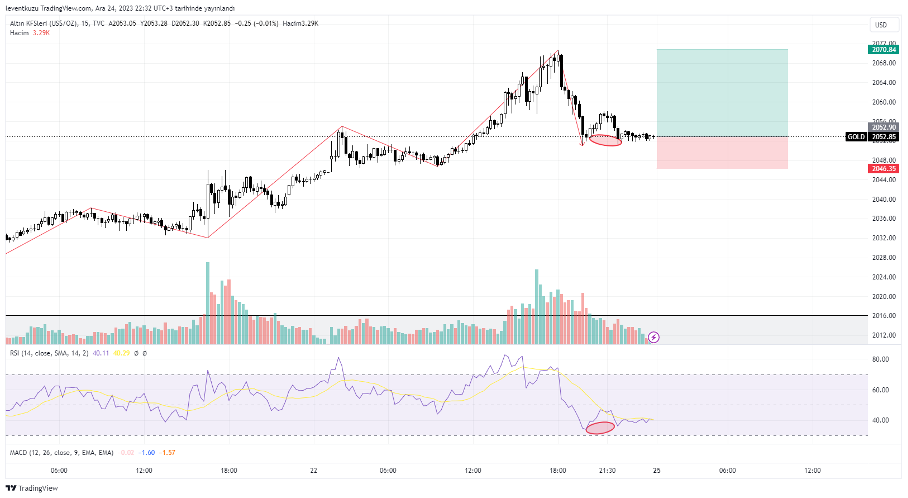
15 min analysis
There is a bullish market structure continuation on the 15 min chart. the price is around 0.786 of the last up leg. There is a bullish RSI divergence on the short term. A bullish movement can be expected. In this case, stop can be the last higher low and take profit can be selected as the last higher high. Position risk reward ratio will be 2.74.
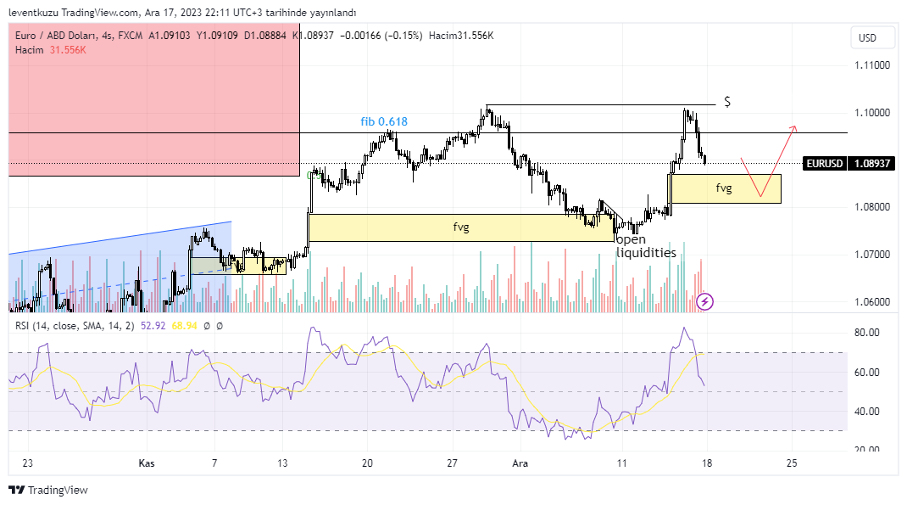
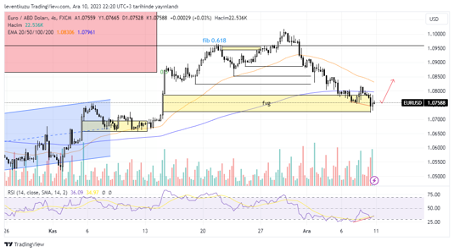
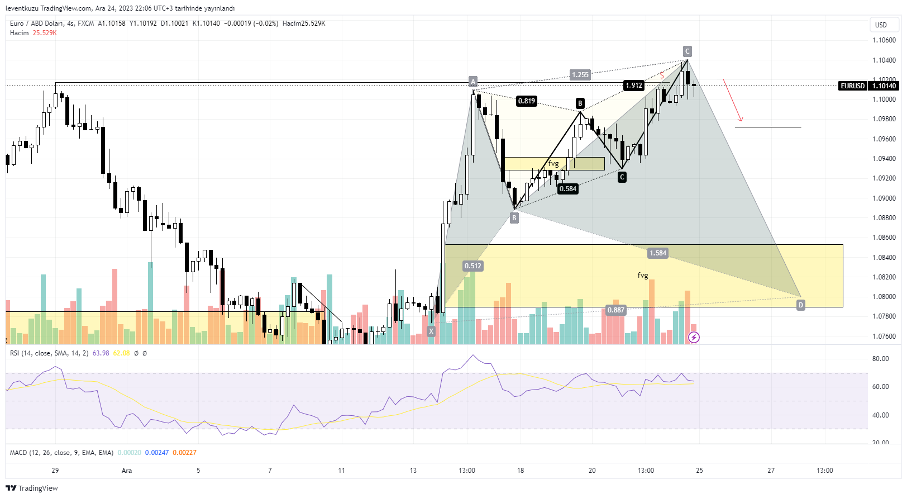
EURUSD
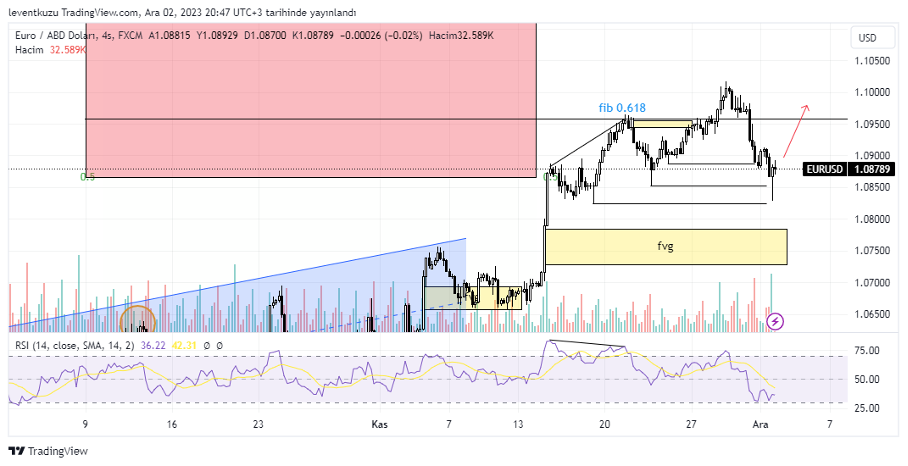
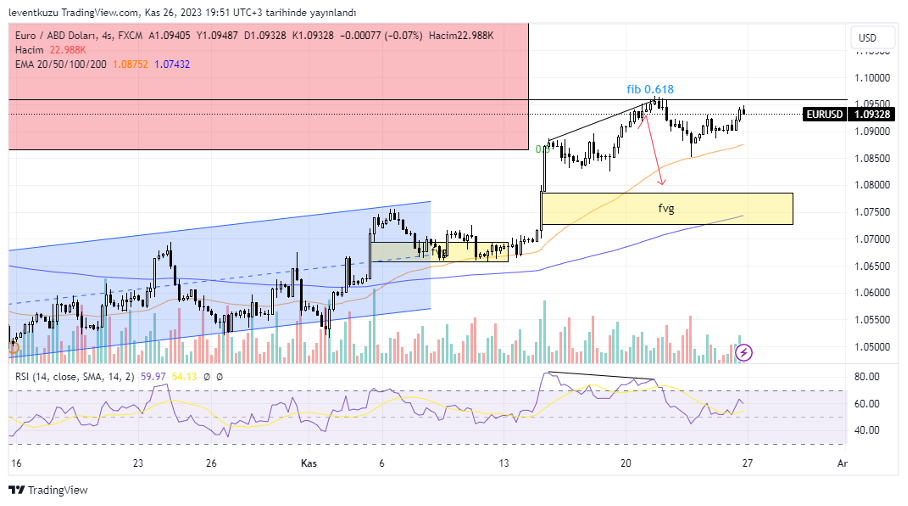
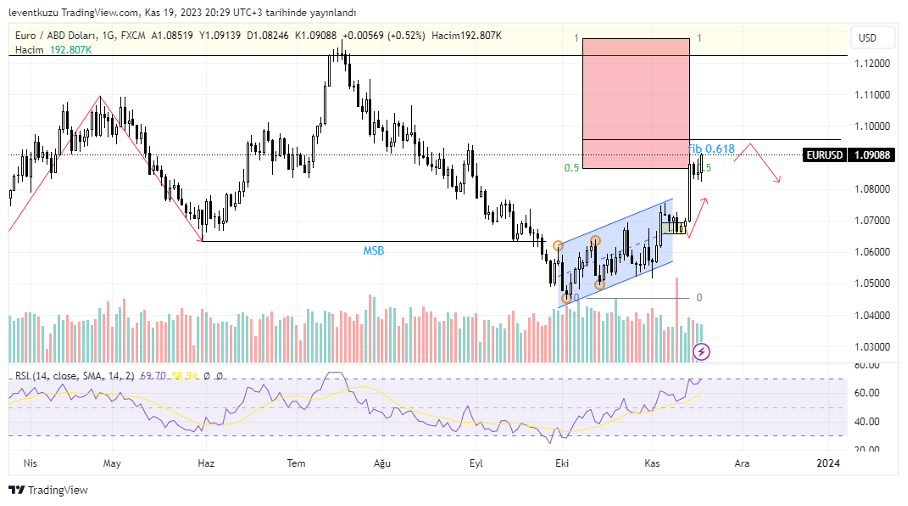
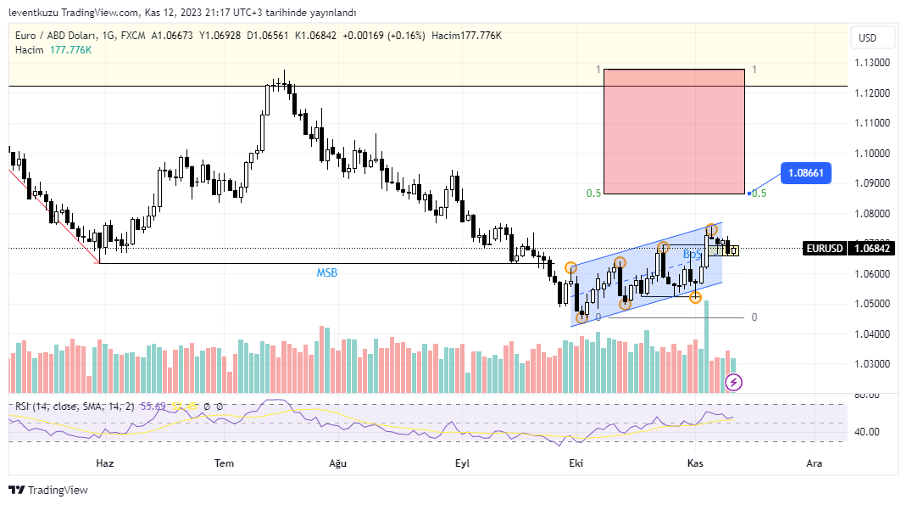
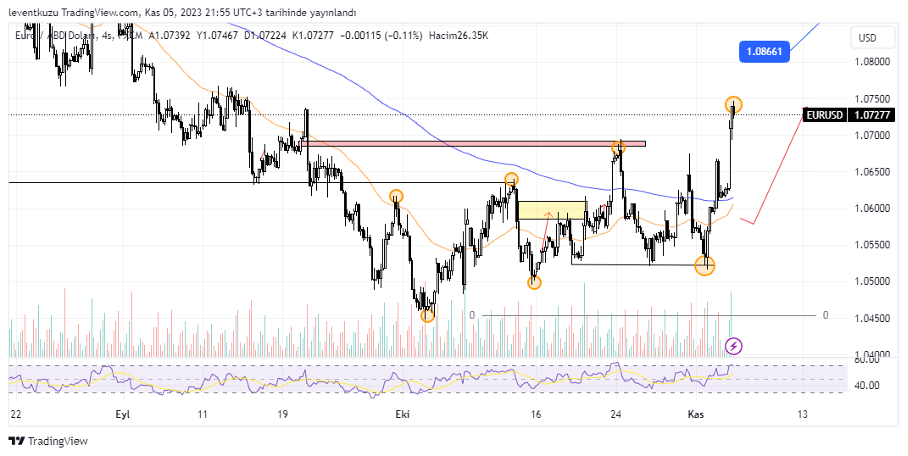
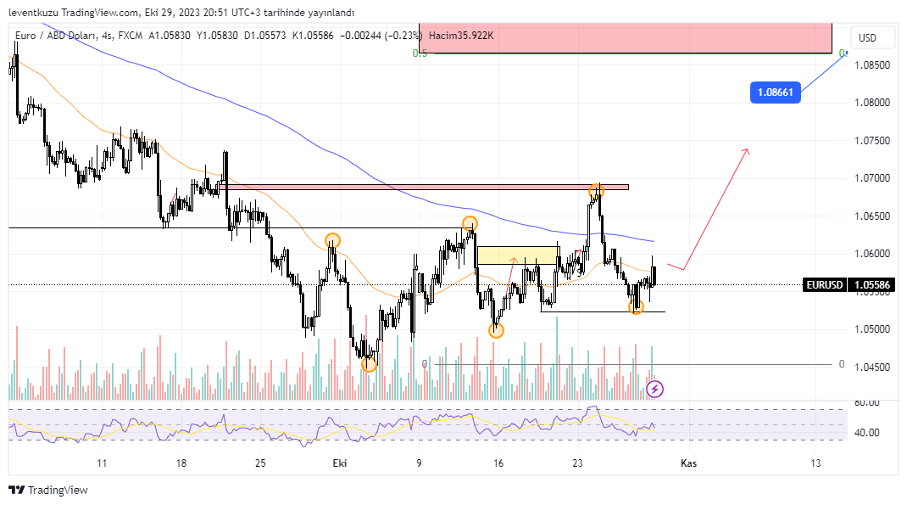
4H analysis
The price path expectation according to the analysis of last week was to reach the small FVG zone and then visit the bigger FVG then take the liquidity at 1.1 pair price. The pair price reached the small FVG but did not reverse from that zone, instead it moved forward to take the liquidity. .during that move, a bearish butterfly was formed. Target of that pattern is 1.097. On the other hand, we observe an unfinished pattern, which is shown by light gray colour. According to this formation, the price is around C point of the harmonic pattern. The probable D point will be within the unvisited FVG zone between 1.085 and 1.079 pair price. Additionally, a bearish RSI divergence is present between A and D points of bearish butterfly pattern.
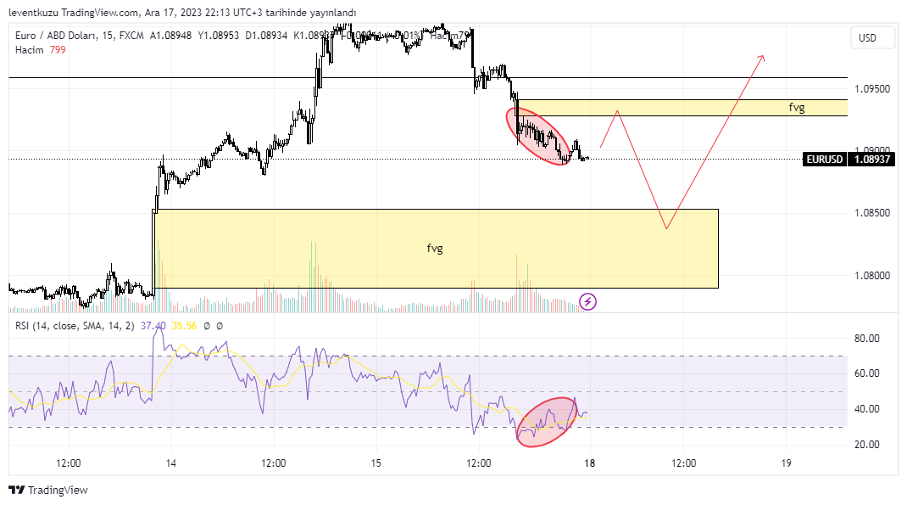
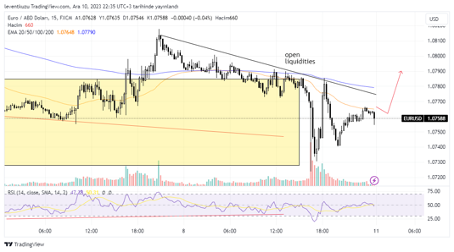
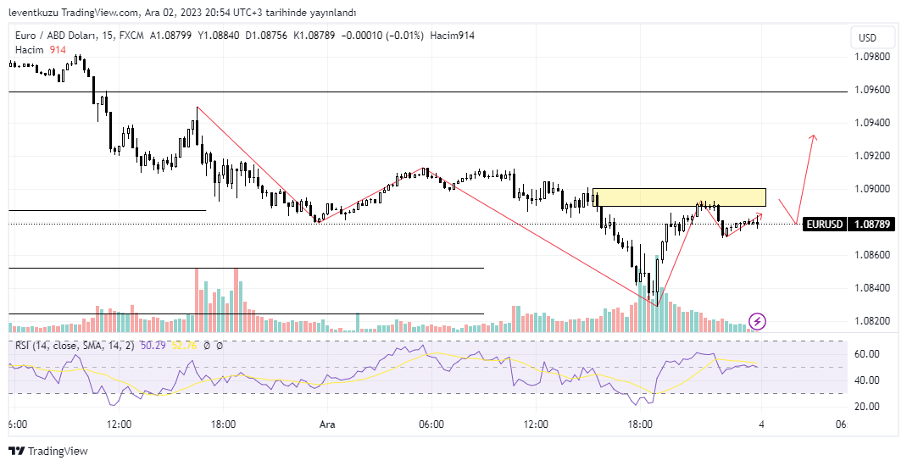
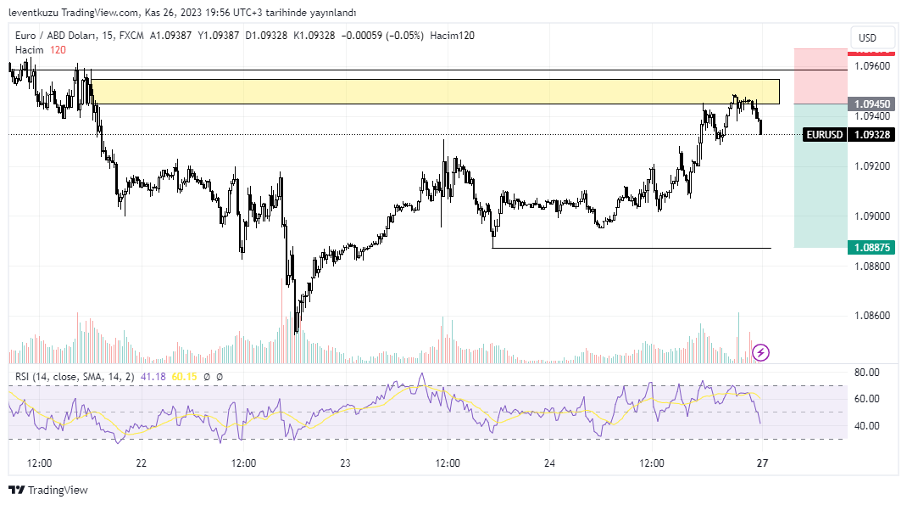
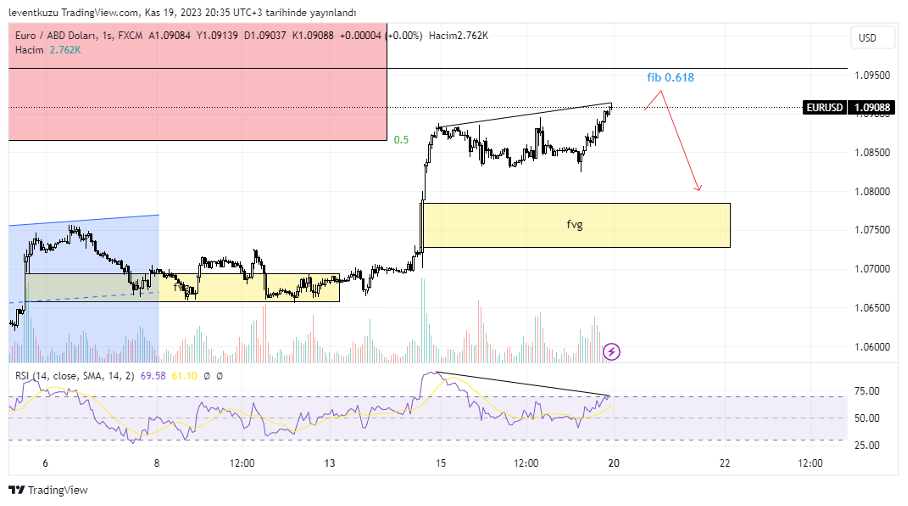
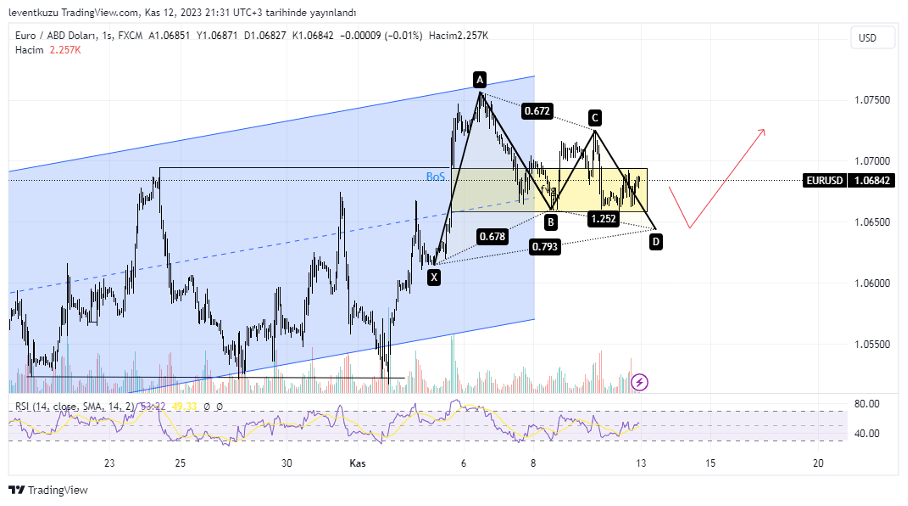
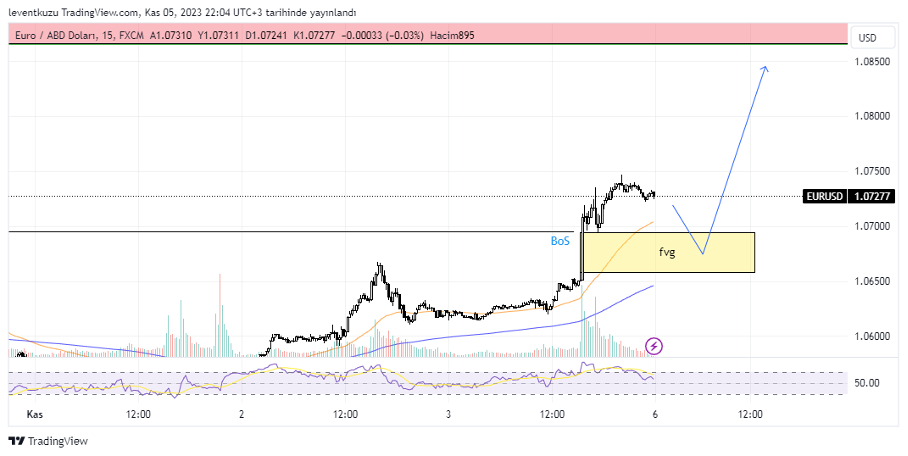
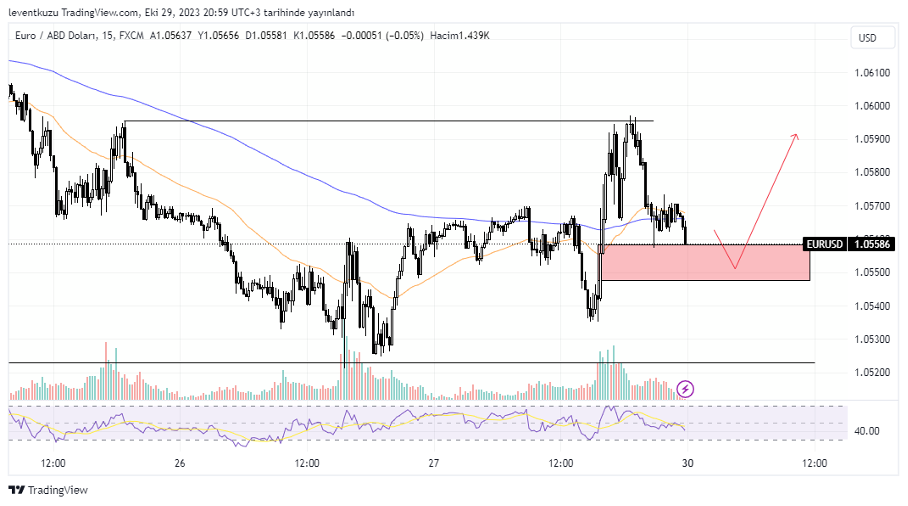
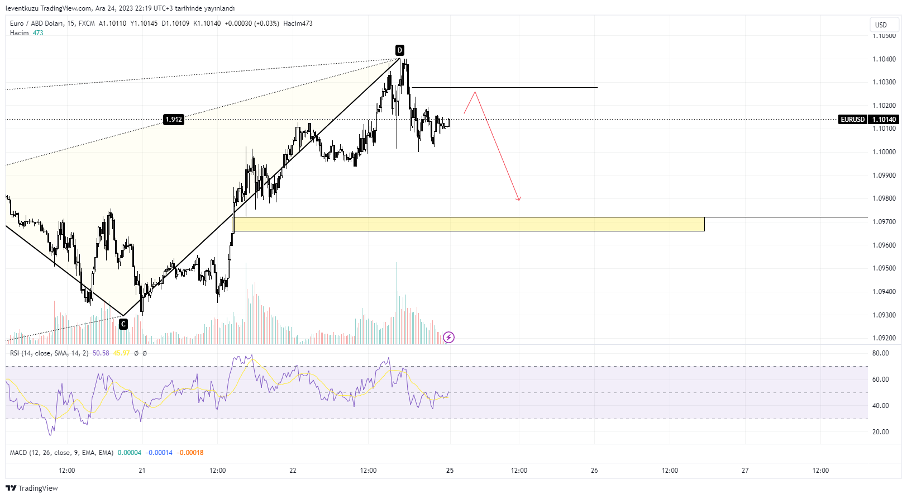
15 min analysis
On the short term chart, the availability of bearish butterfly pattern is visible. Price dropped from D point with a bearish RSI divergence. There is also a possible shoulder-head-shoulder formation. If it is occurred, the target will fit to the target of the harmonic pattern. It is also top of the closest FVG zone.
** Important Note: Above ideas are not investment advice!**
Nihat Çetinkaya
https://twitter.com/nhtctnk
I’m a private trader of over 7 years, based in Istanbul.
All trading and research are my opinion, not investment advice.