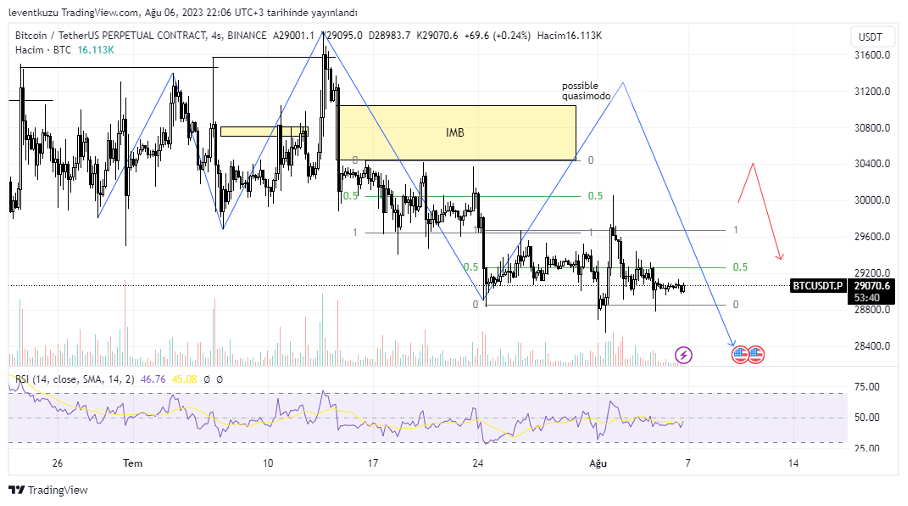
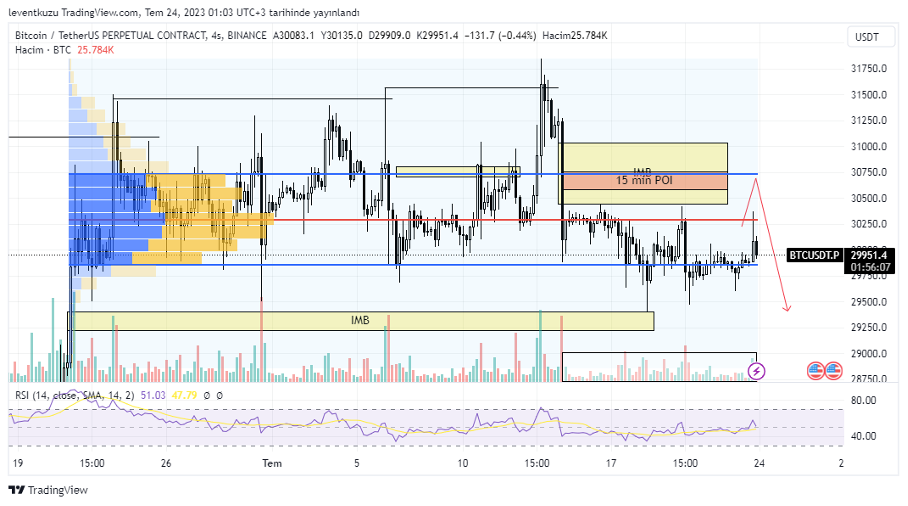
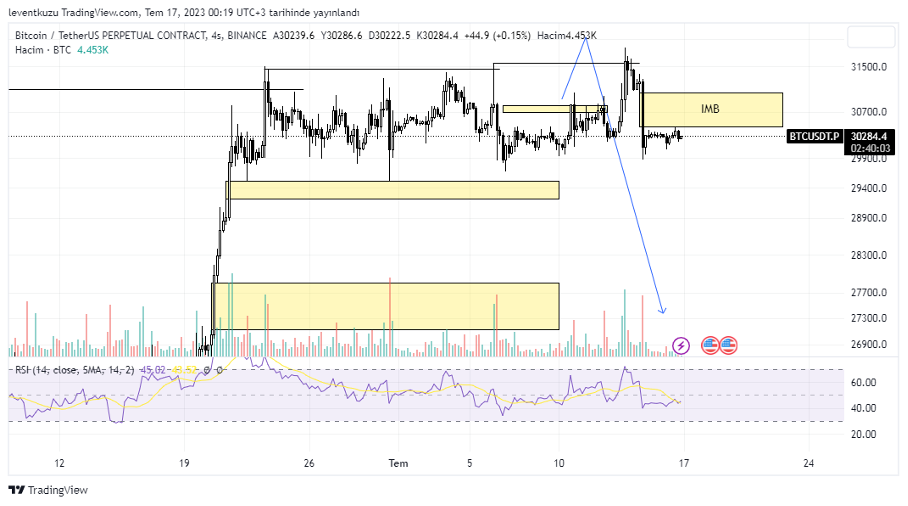
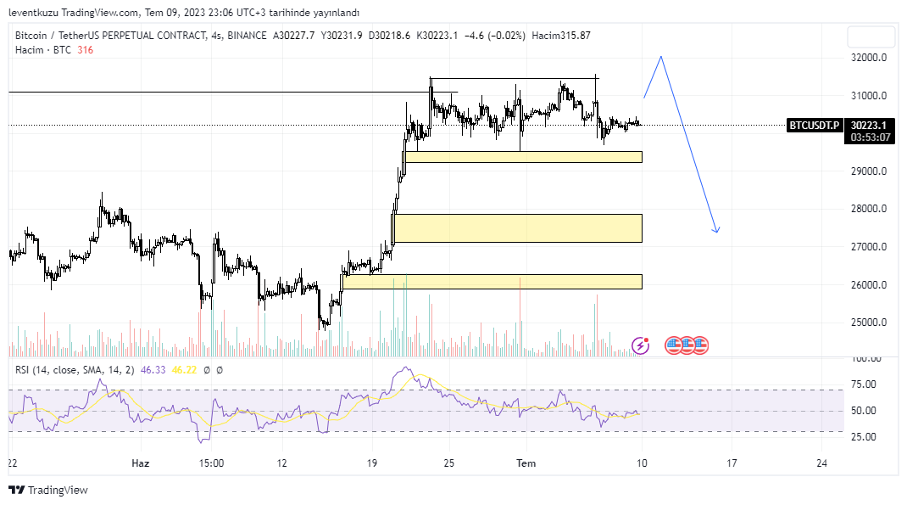
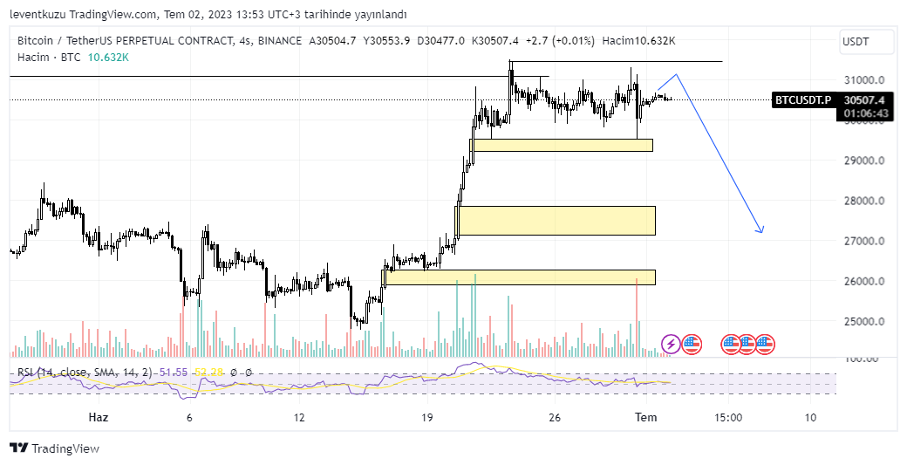
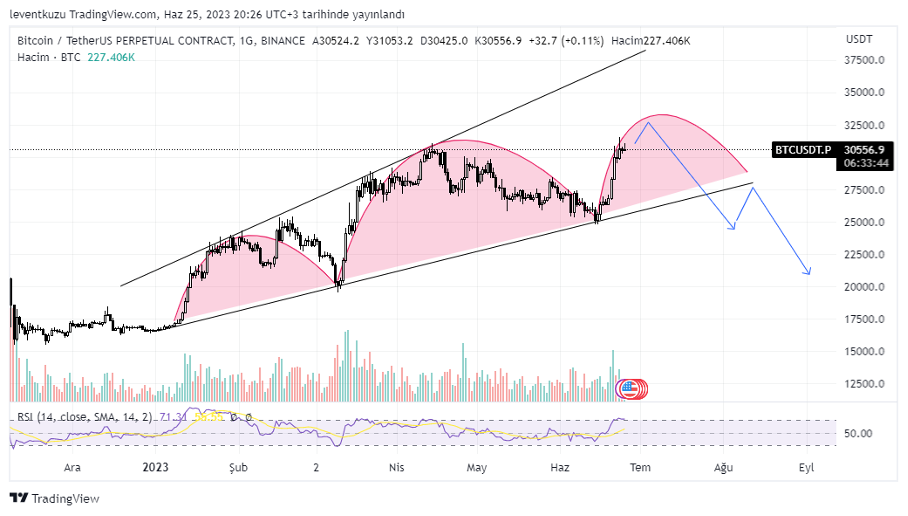
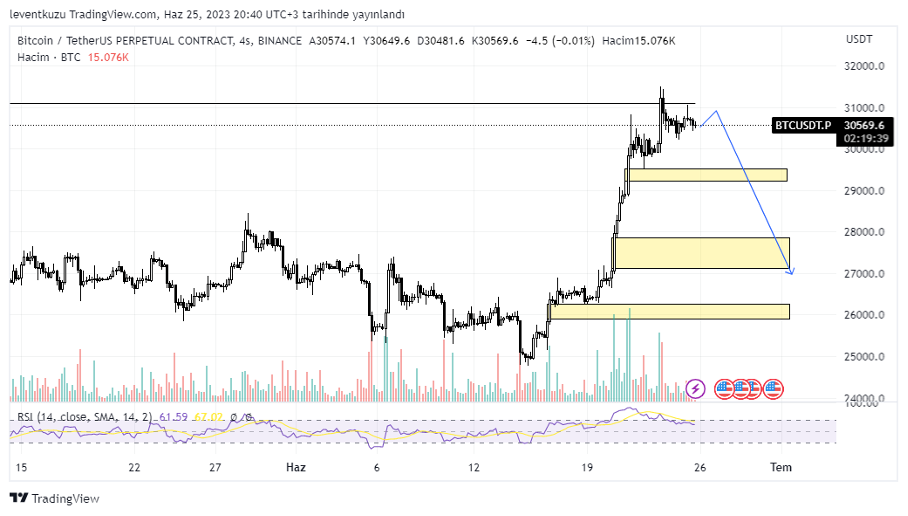
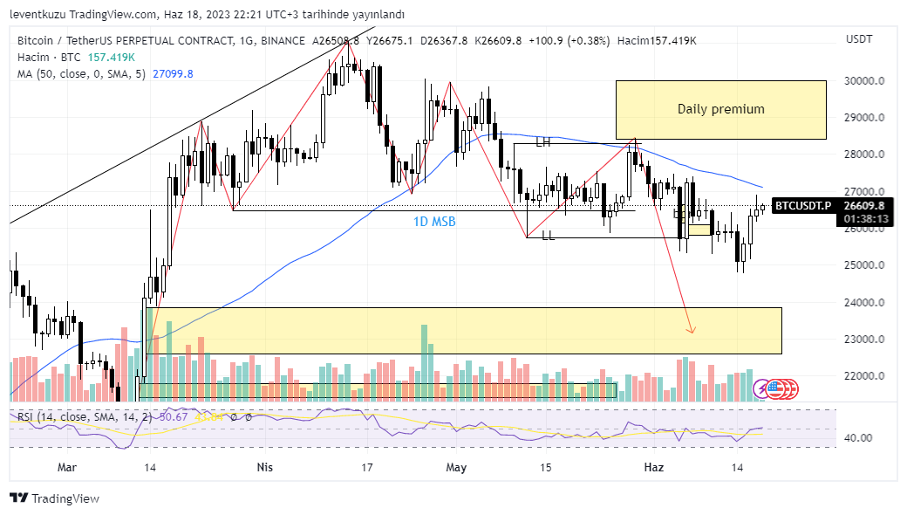
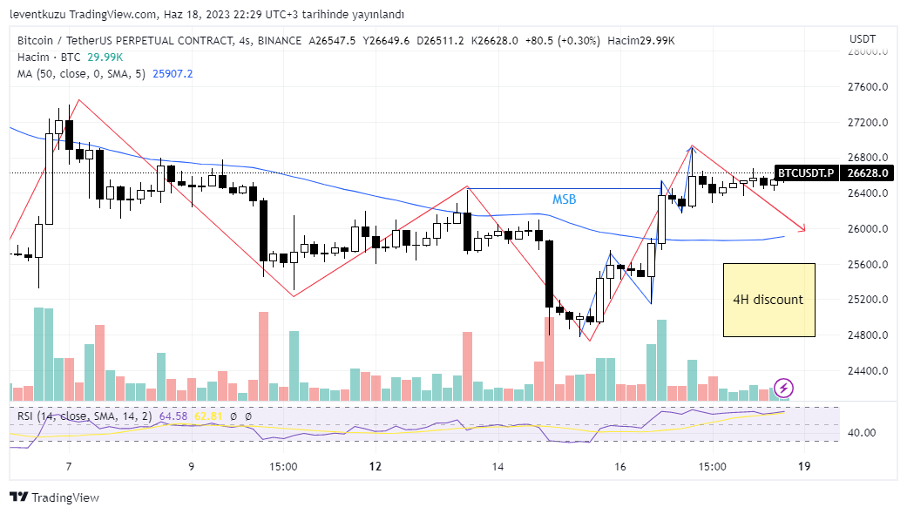
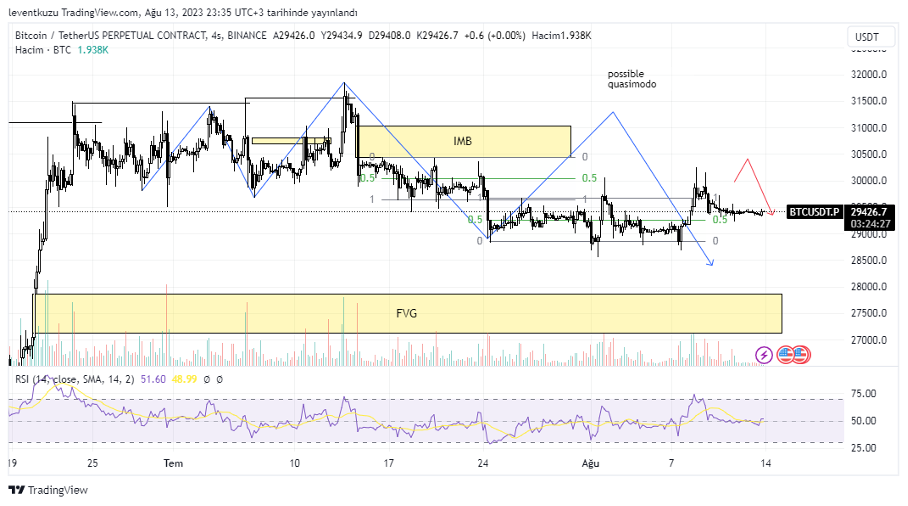
BTCUSDT
4H analysis
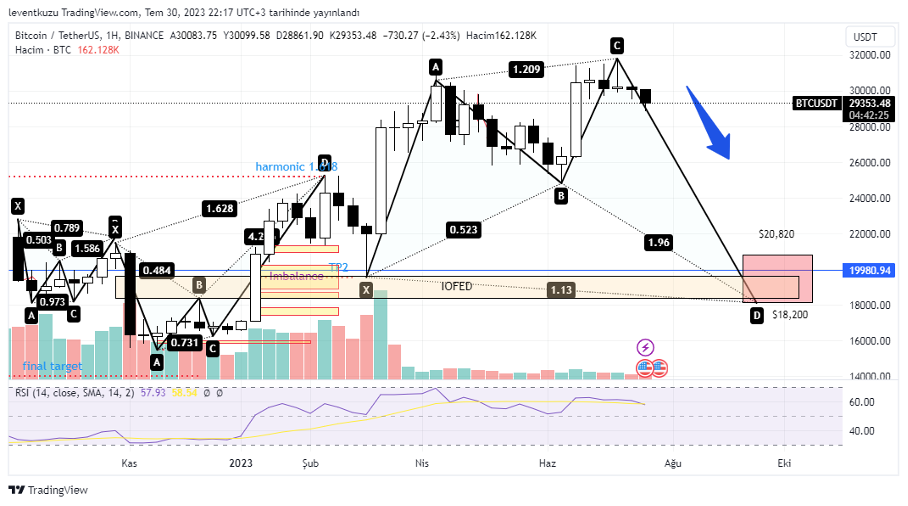
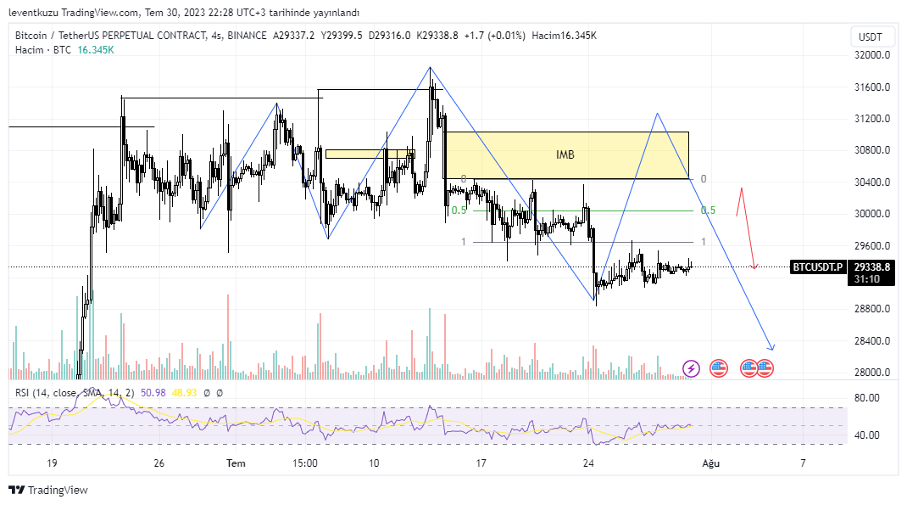
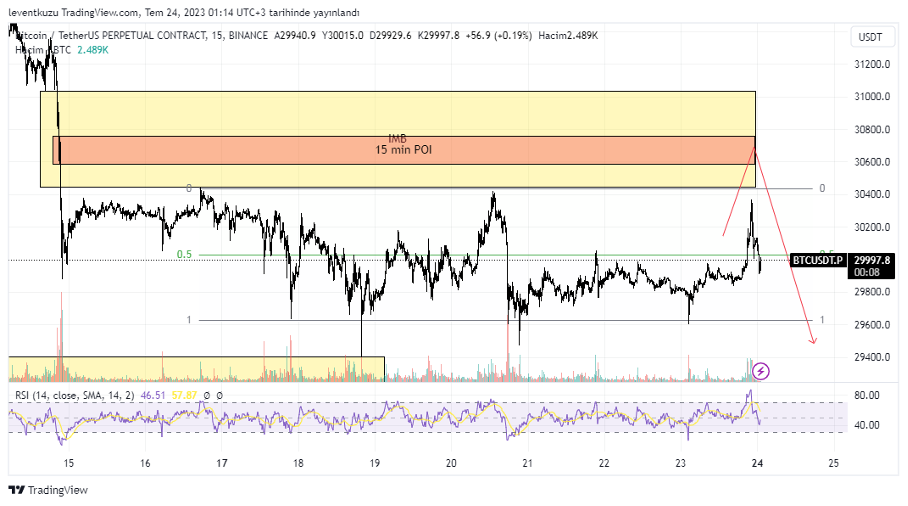
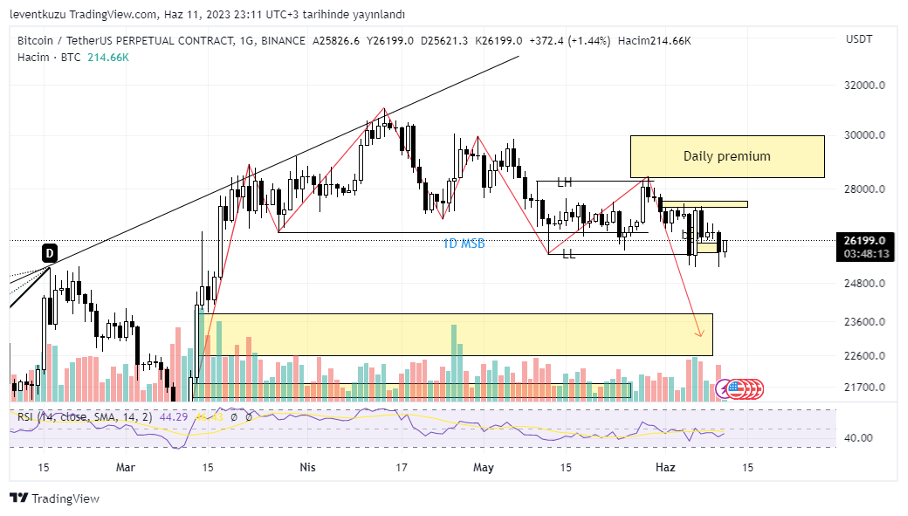
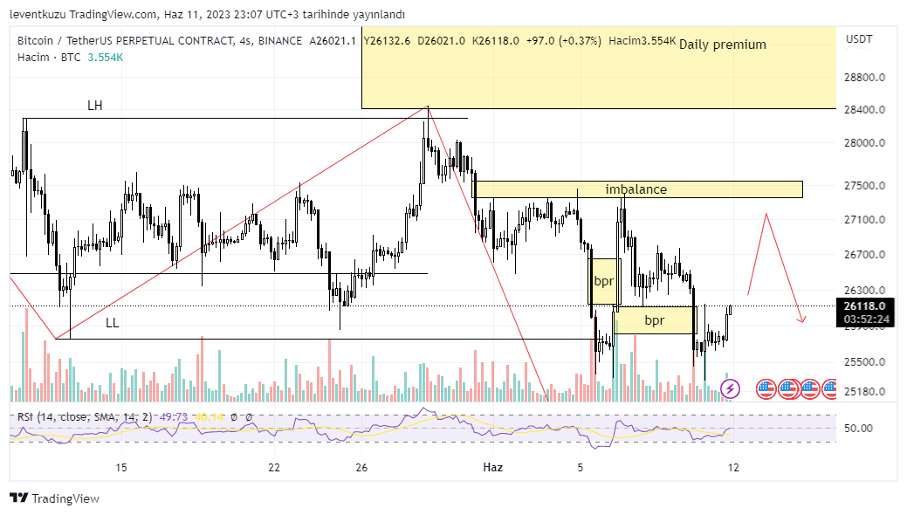
After many weeks, we are still suffering from the shallow market in BTCUSDT pair. Also the volume of the pair reduced drastically. The path shown by red colour was from last week’s bulletin. The price reached $30,400s. But this is not to fulfil a Quasimodo pattern that is shown by the blue path. If the pattern is formed accurately, we may expect the below closest FVG at first. I aim to wait for a significant movement before making predictions in other time frames as with the last two weeks.
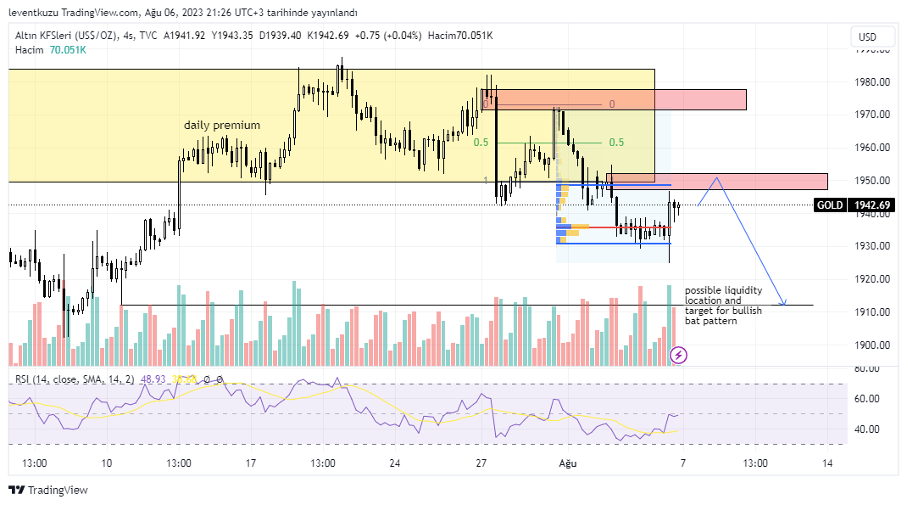
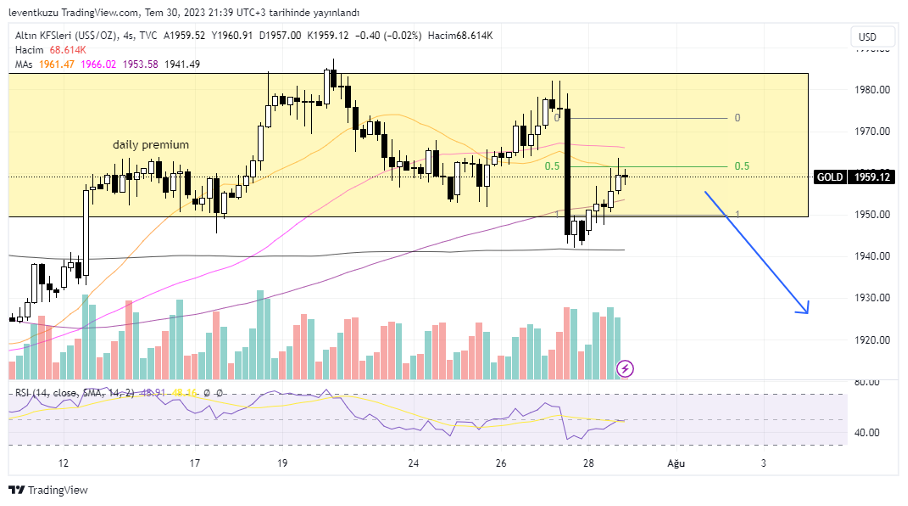
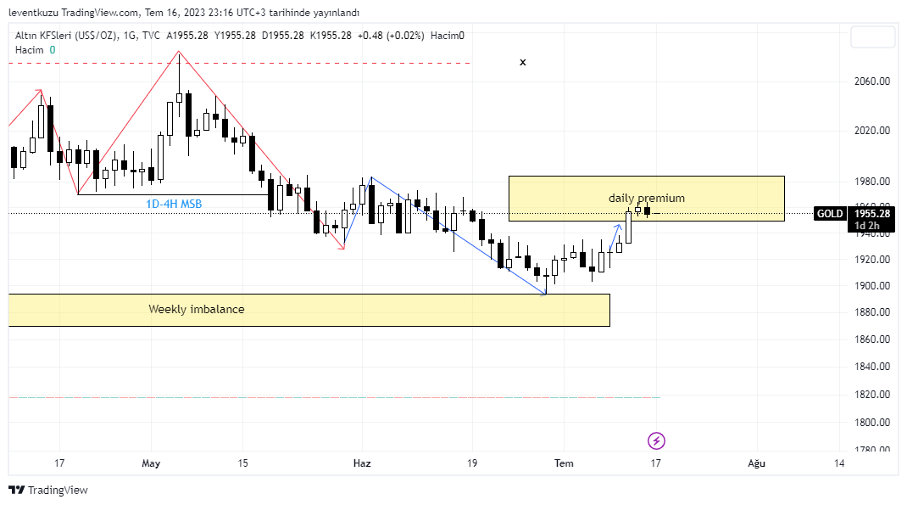
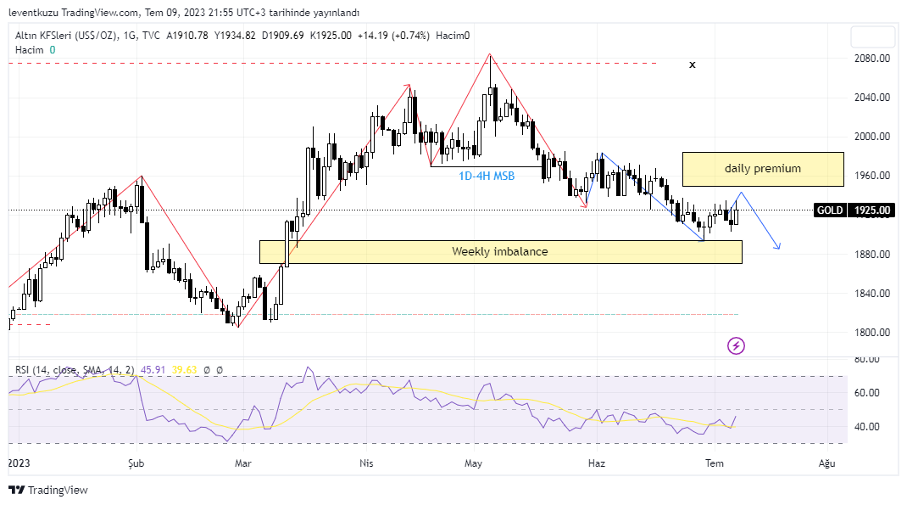
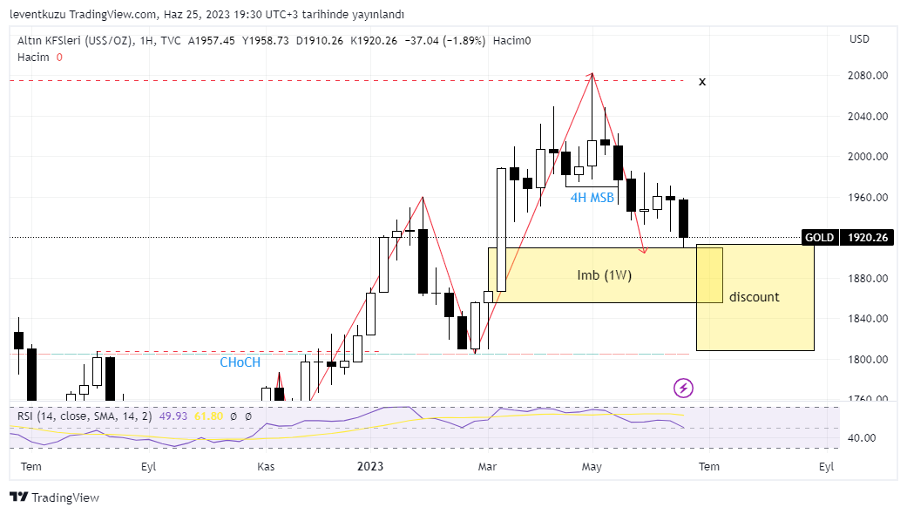
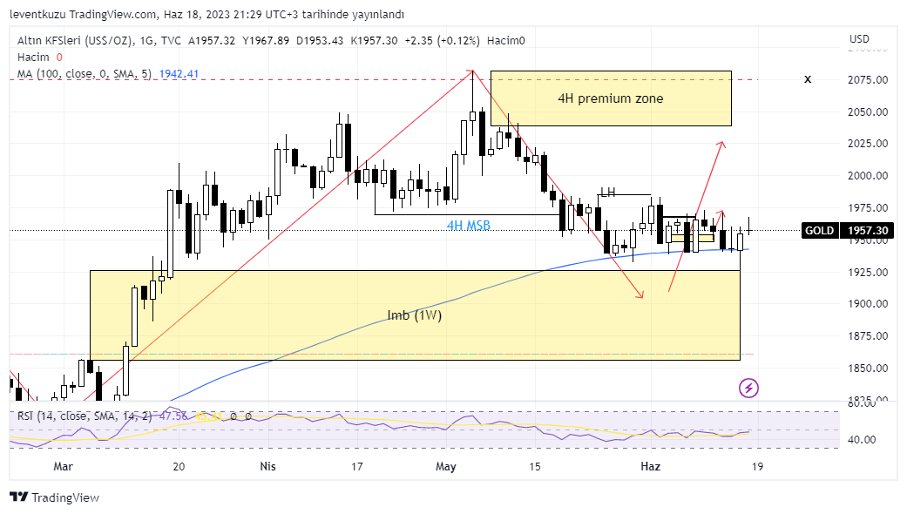
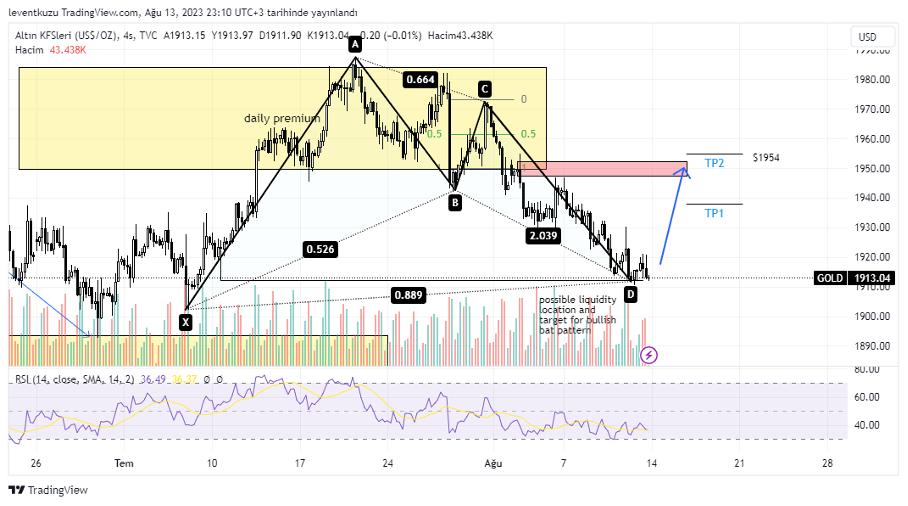
XAUUSD
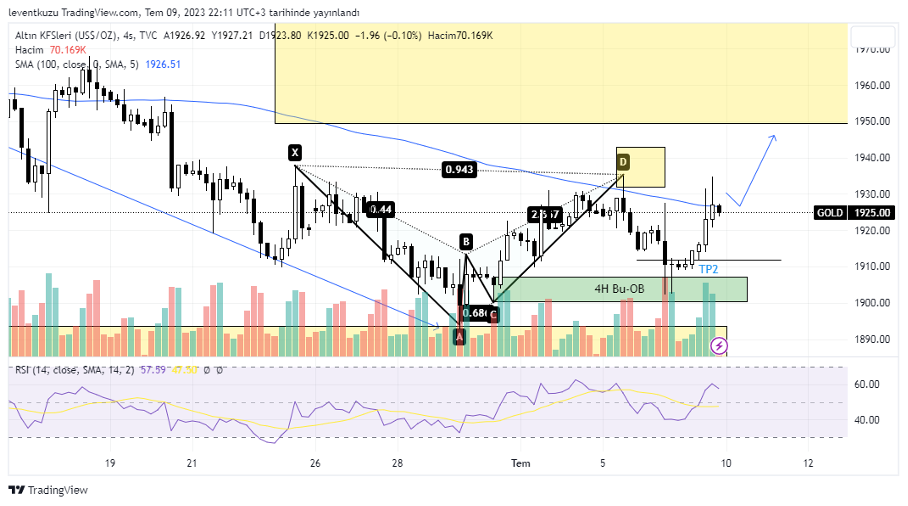
4H analysis
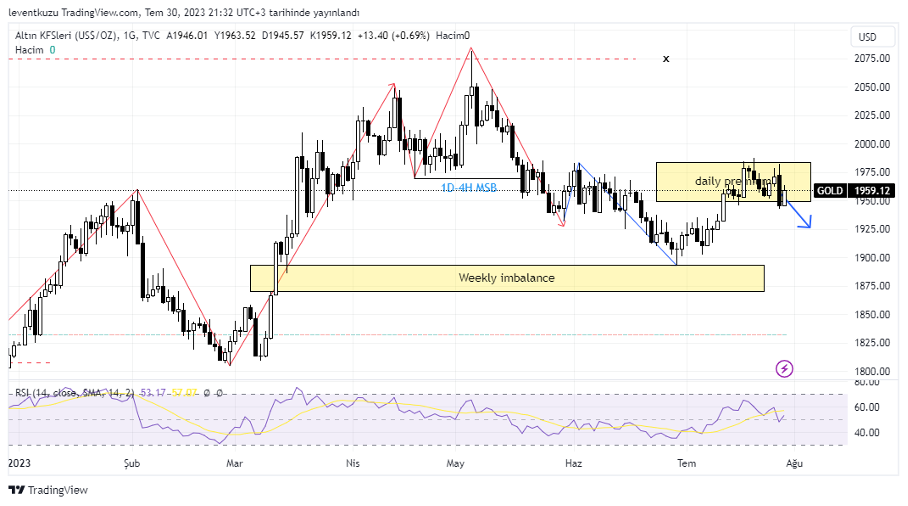
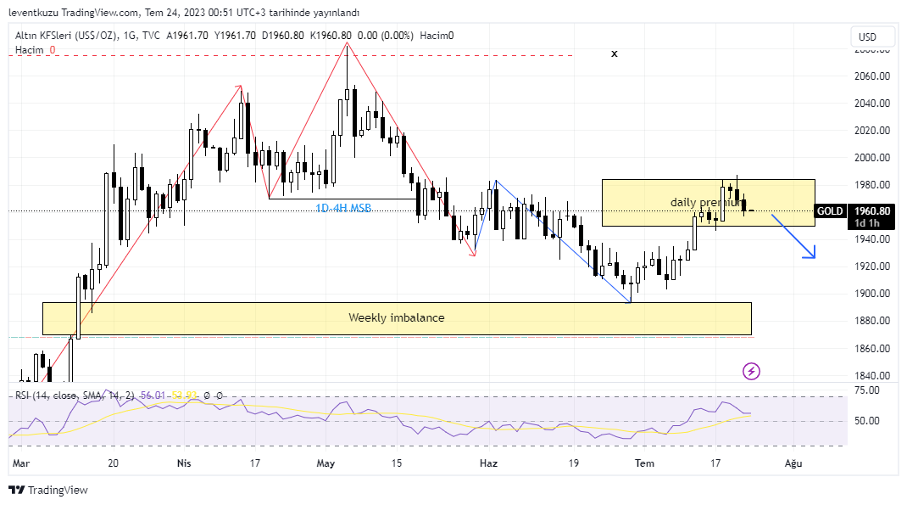
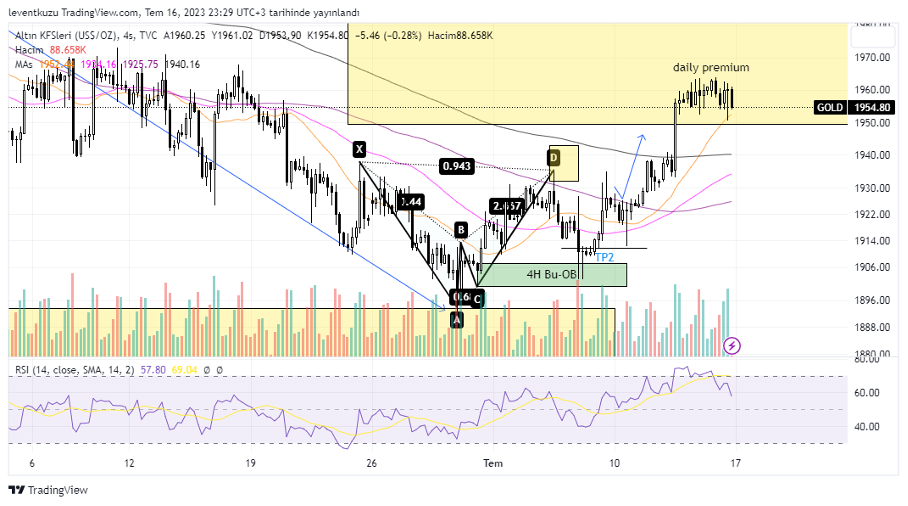
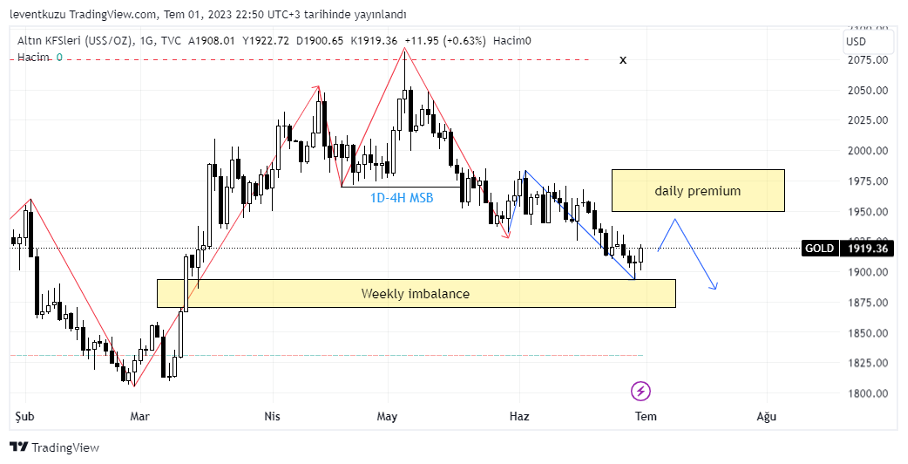
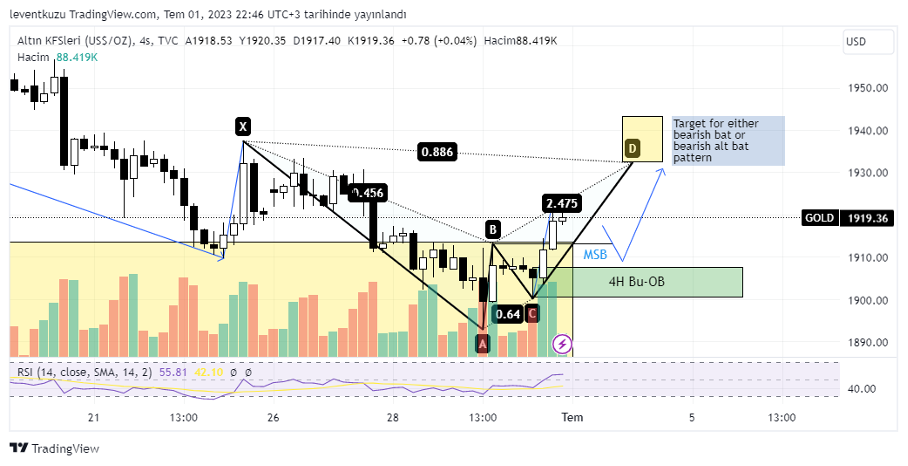
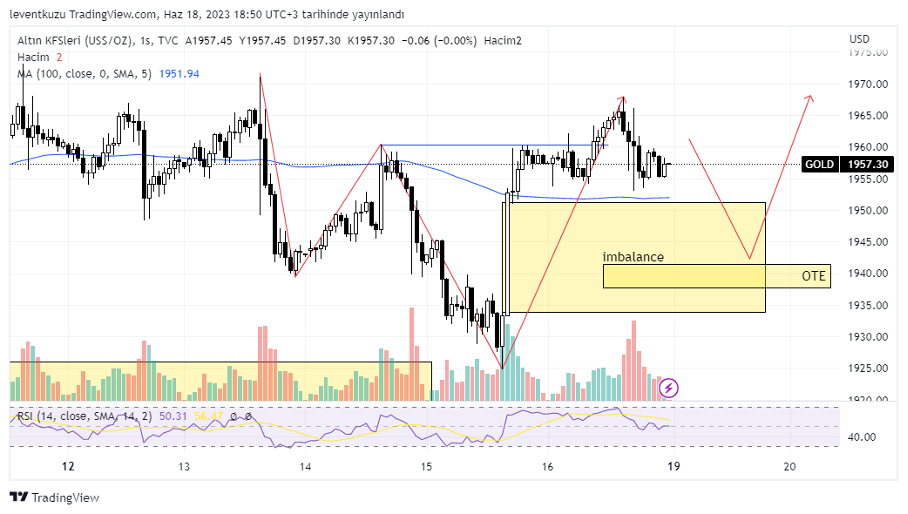
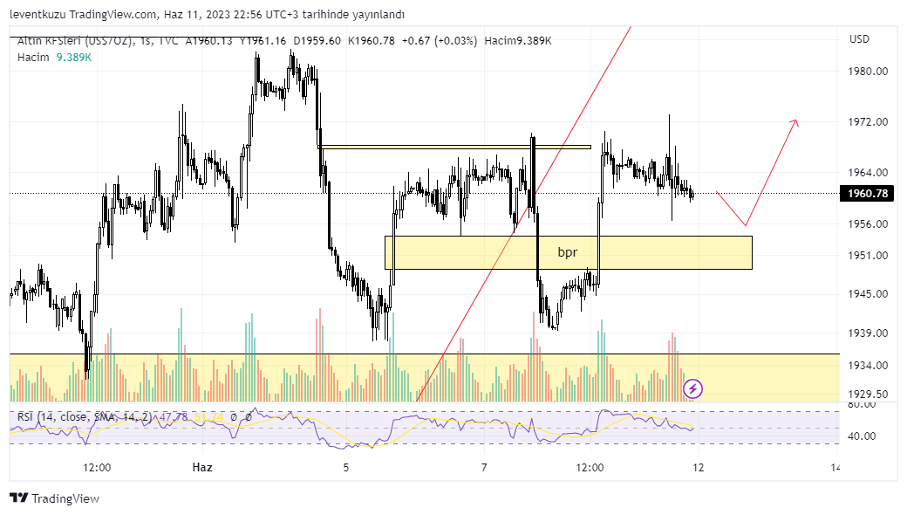
Price of XAU perfectly fit to our estimation. There was a liquidity shown last week. We stated that if liquidity is taken, price could form a bullish bat pattern. Actually, price took the liquidity and formed the harmonic pattern. Now we can expect TP1 and TP2 points to be reached. But before reaching TP2, we have to be careful at around the red box shown in the figure, which is an order block. Price can somehow cannot pass that zone. The ultimate target on 4H is $1,954 for this pattern.
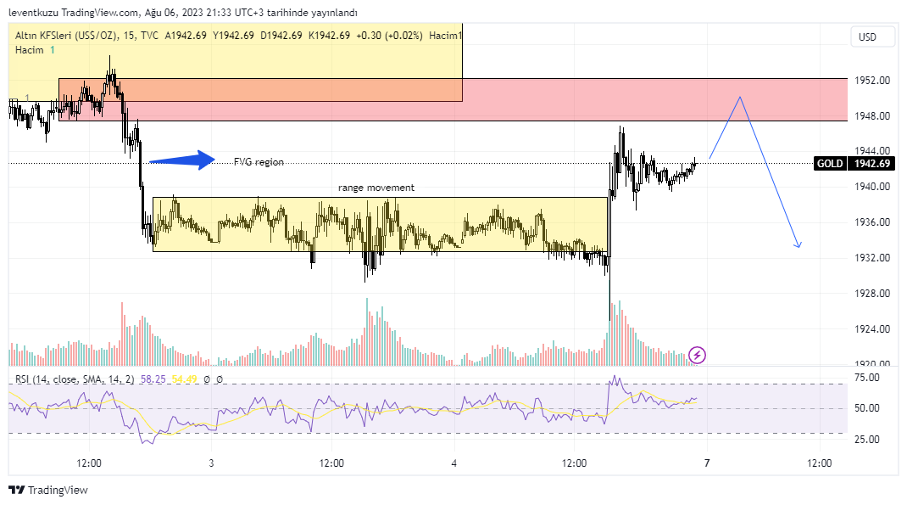
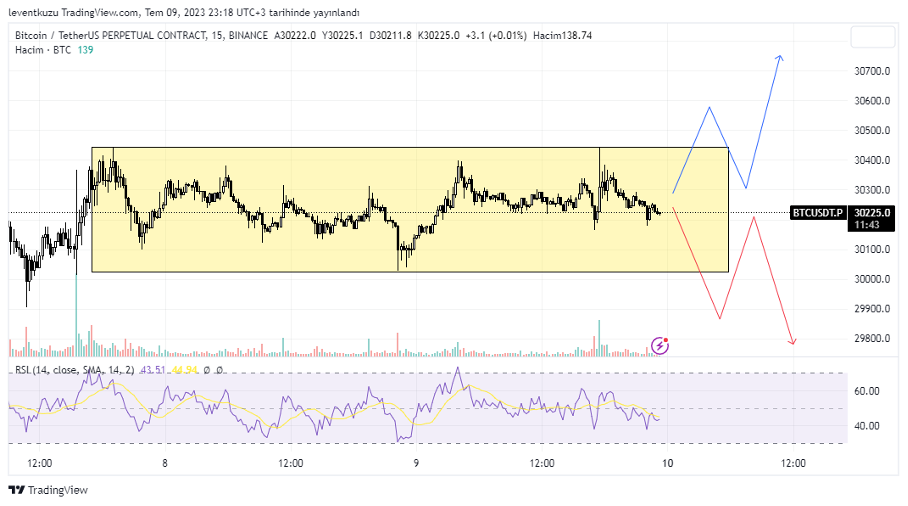
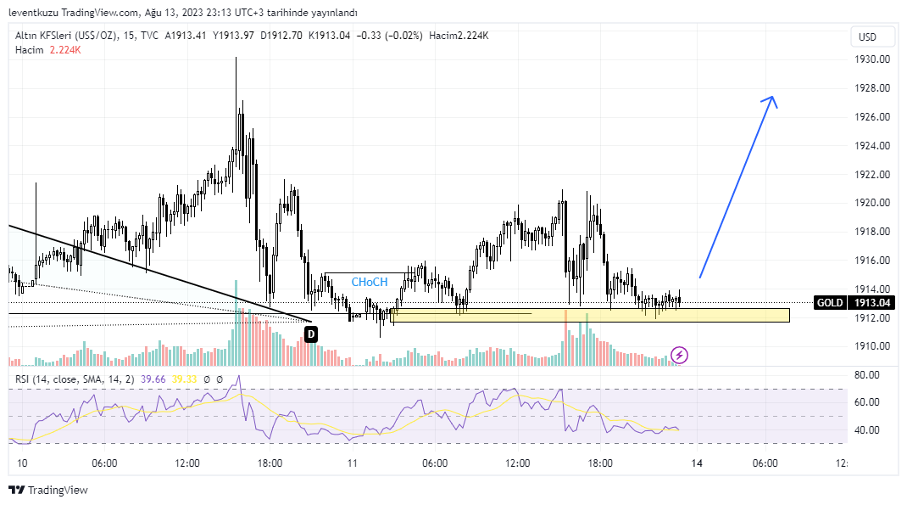
15 min analysis
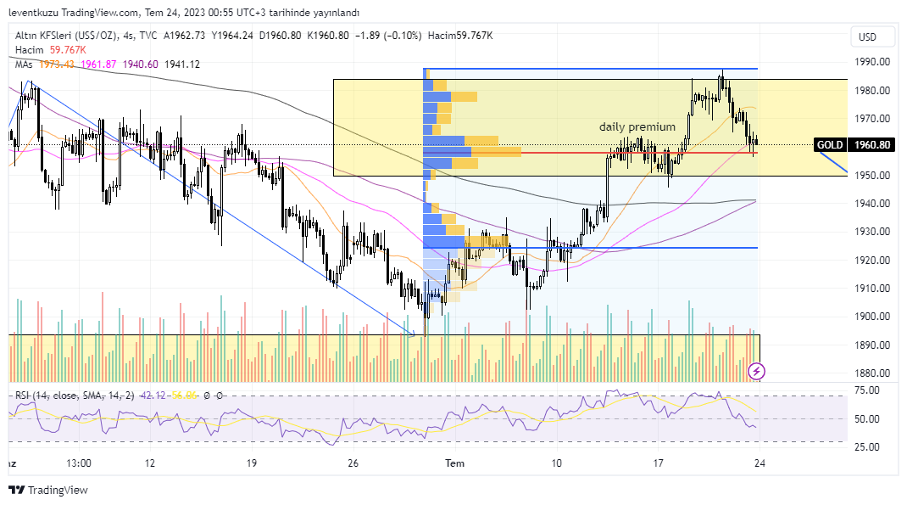
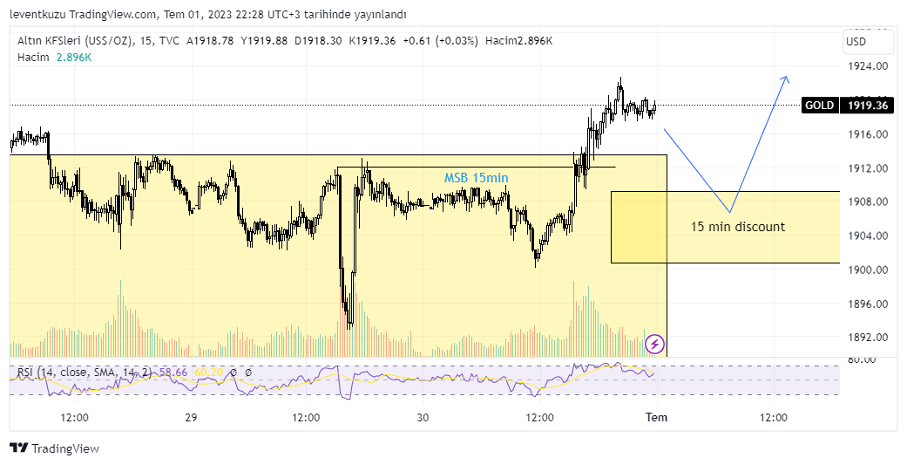
Change of character was formed on 15-min chart. After that, order block was filled several times within this time frame. Additionally, this order block is in harmony with the previous liquidity level. The price did not increase much from the order block and there is good opportunity to take long position. The targets on 4H time frame is valid.
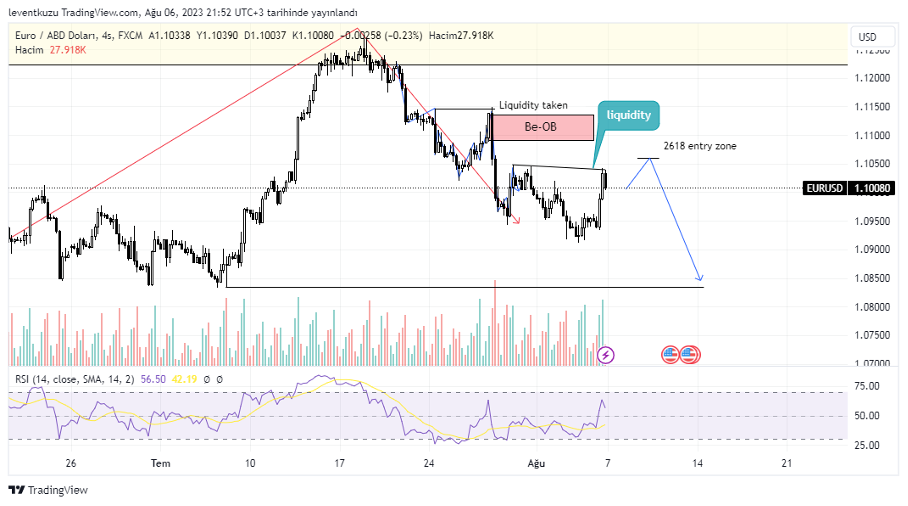
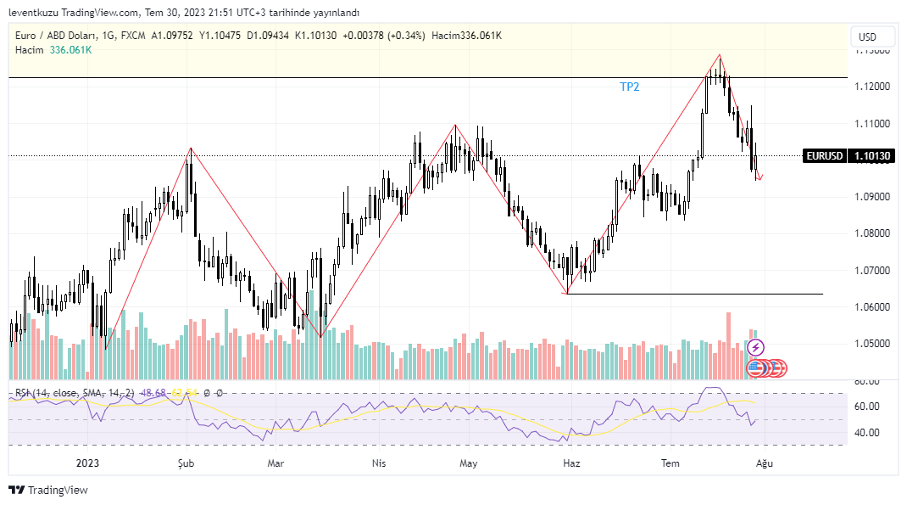
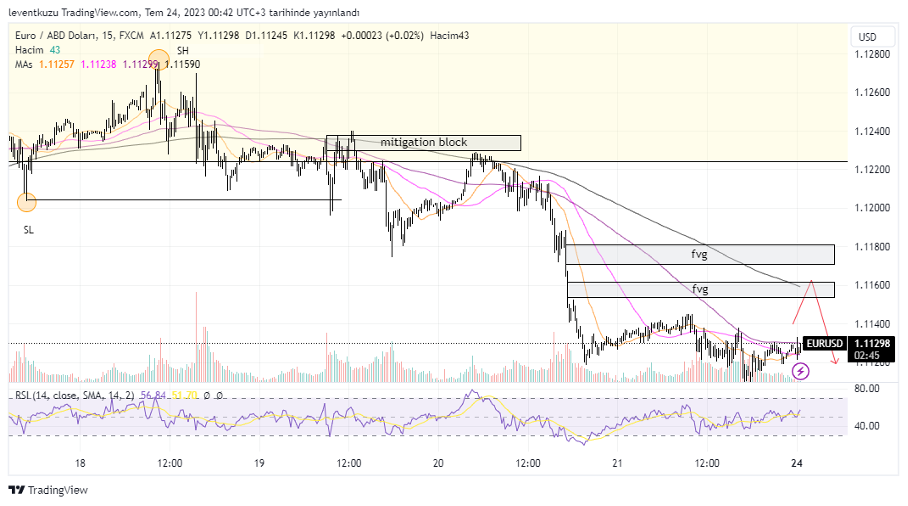
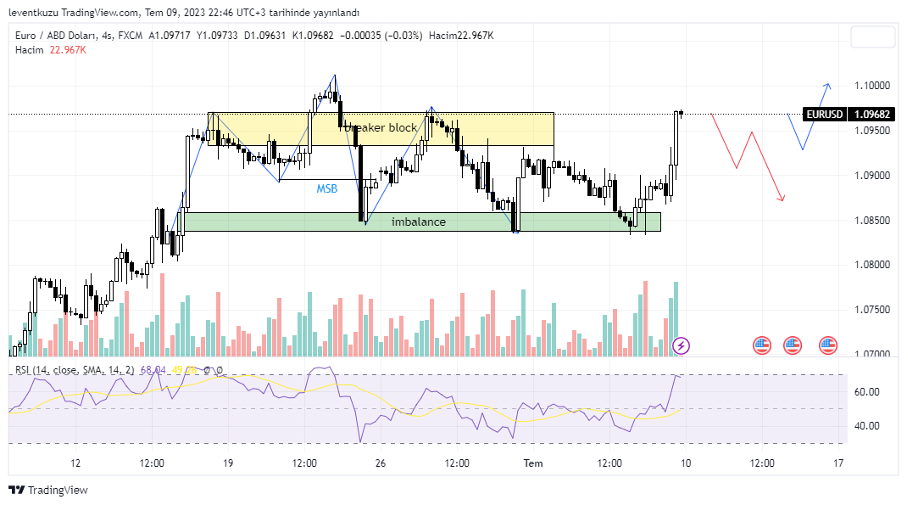
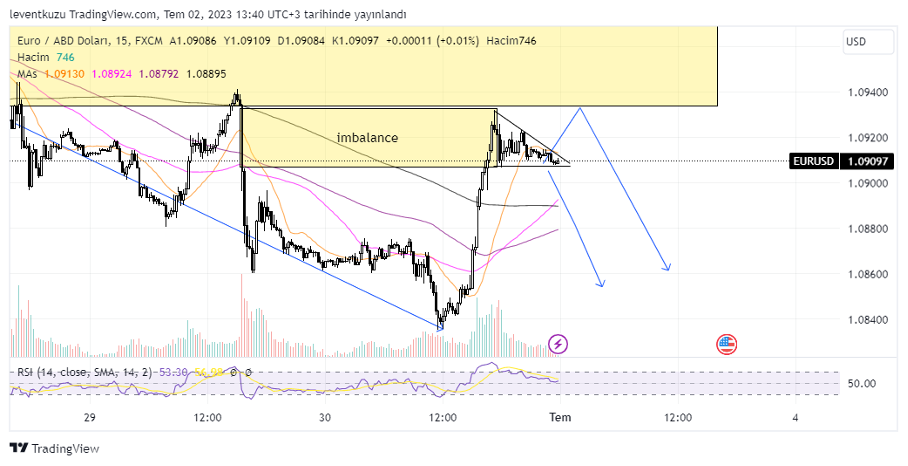
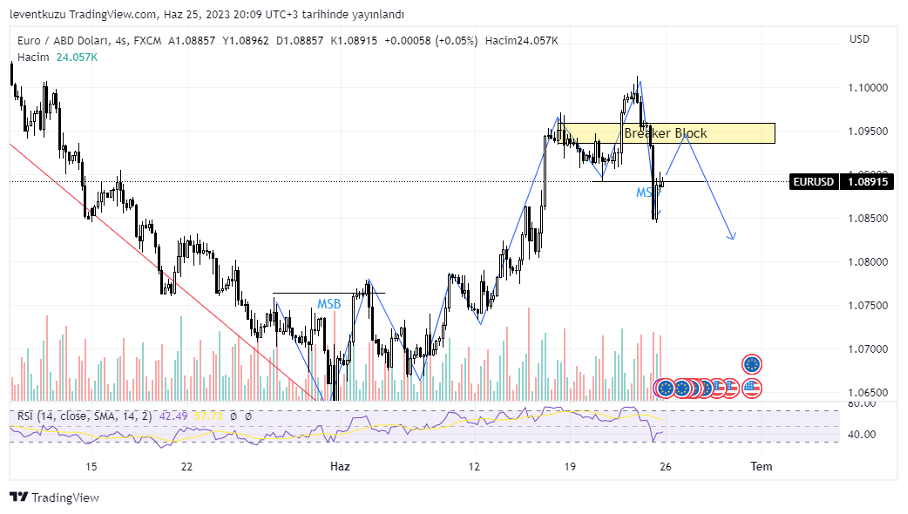
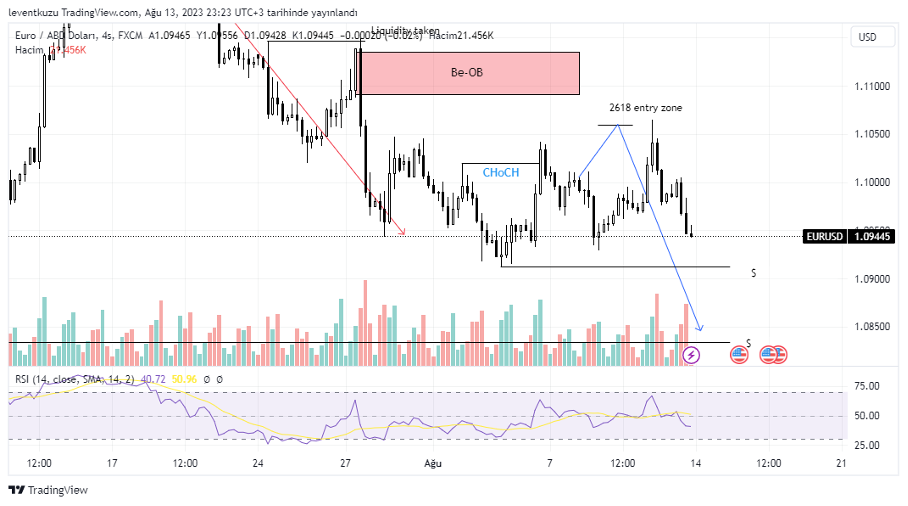
EURUSD
4H analysis
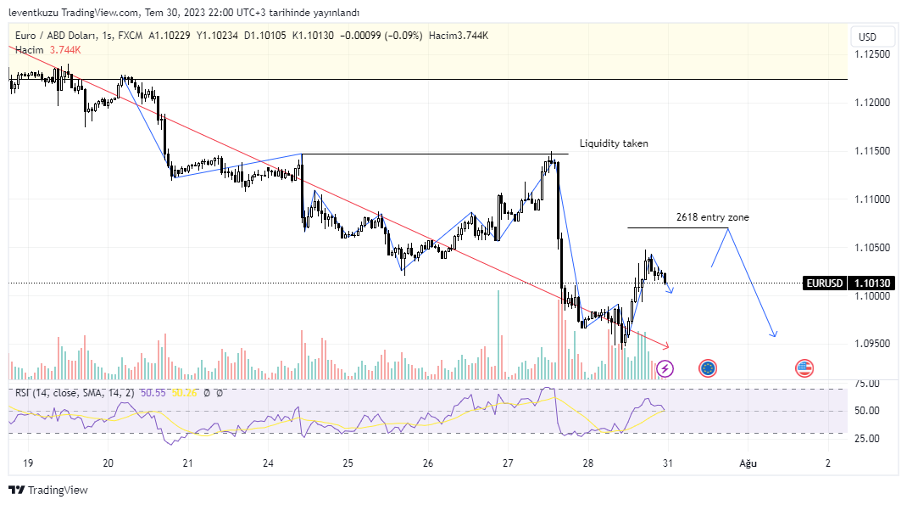
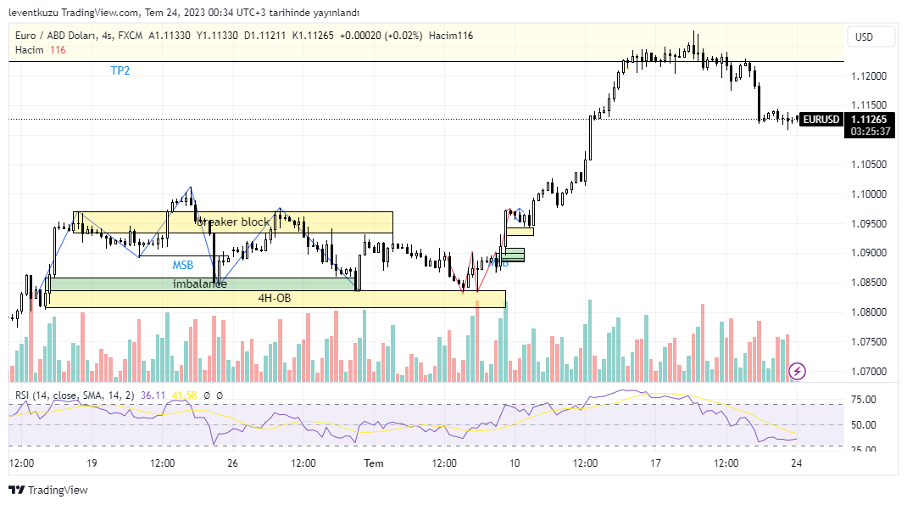
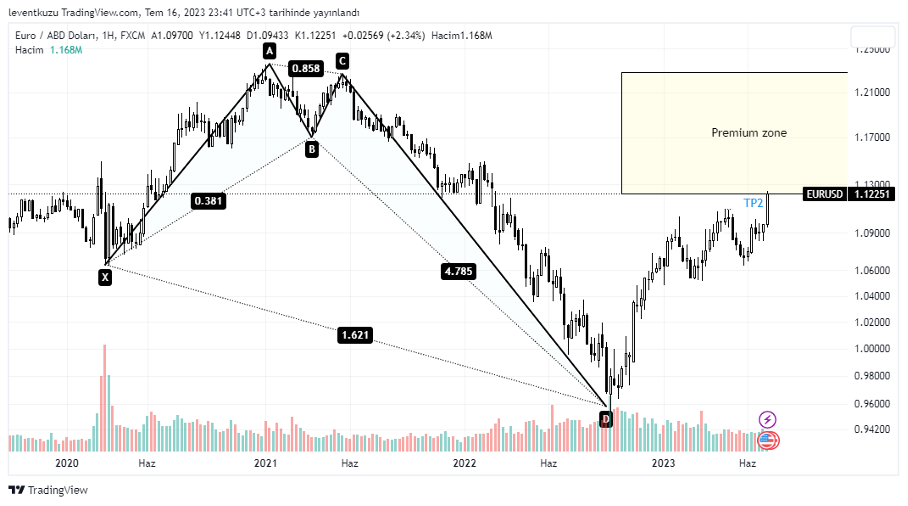
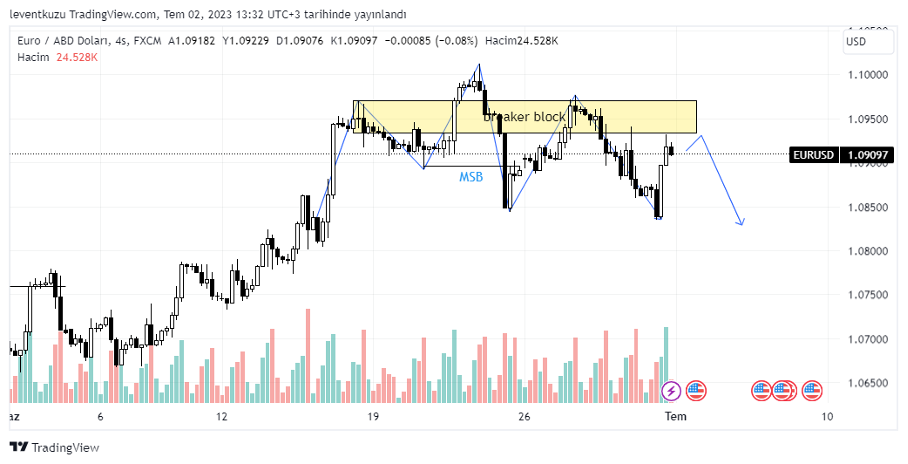
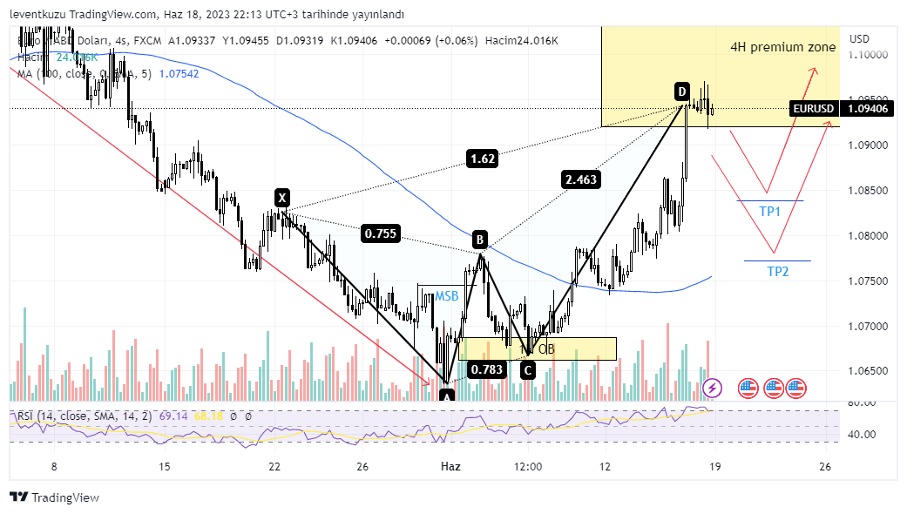
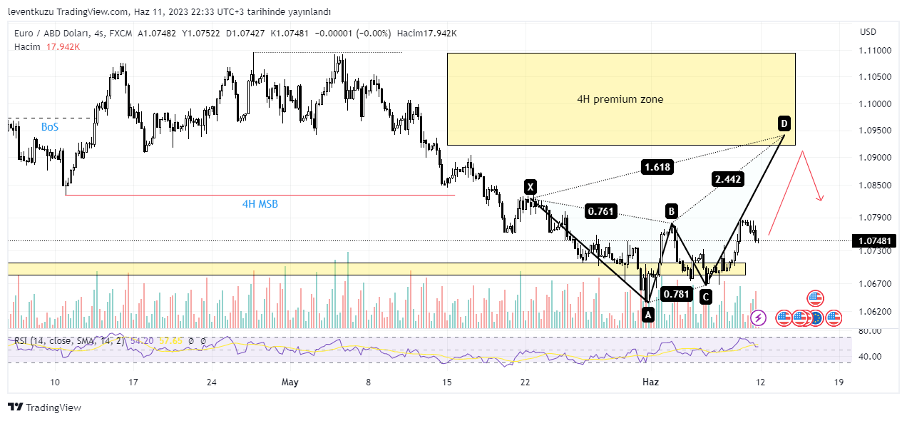
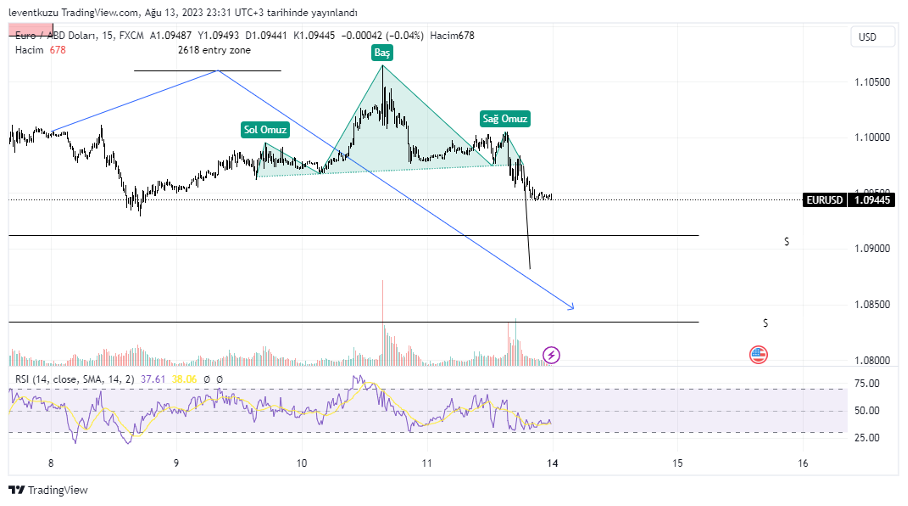
We mentioned about two different regions last week for a possible short position on 4H time frame, although the market structure is still bullish on daily chart. The price reached the first short position zone, which is shown as 2618 entry zone. Now, there are two liquidity targets below that price can reach and shown as $ symbols. The targets are 1.091 and 1.083, respectively.
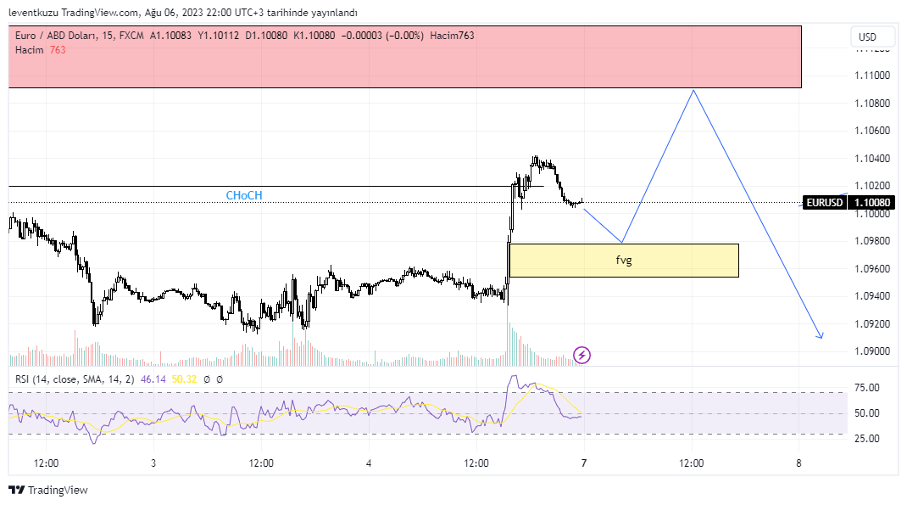
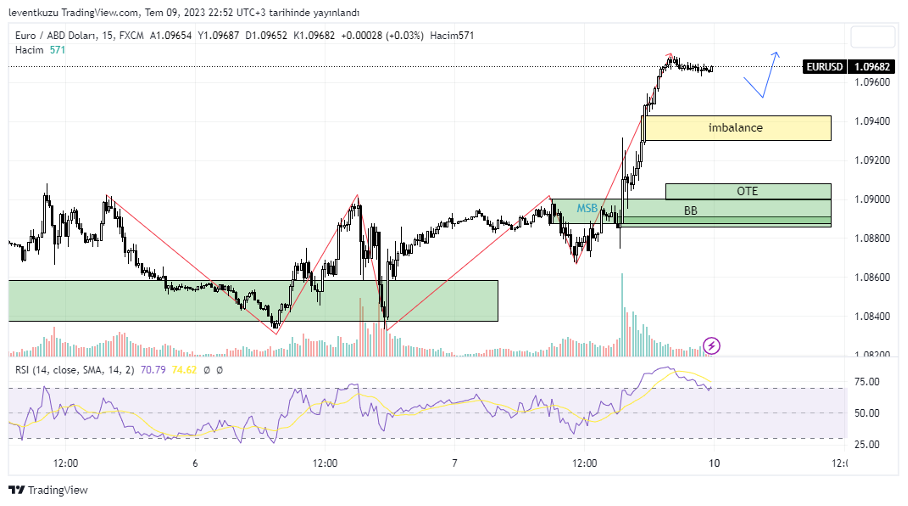
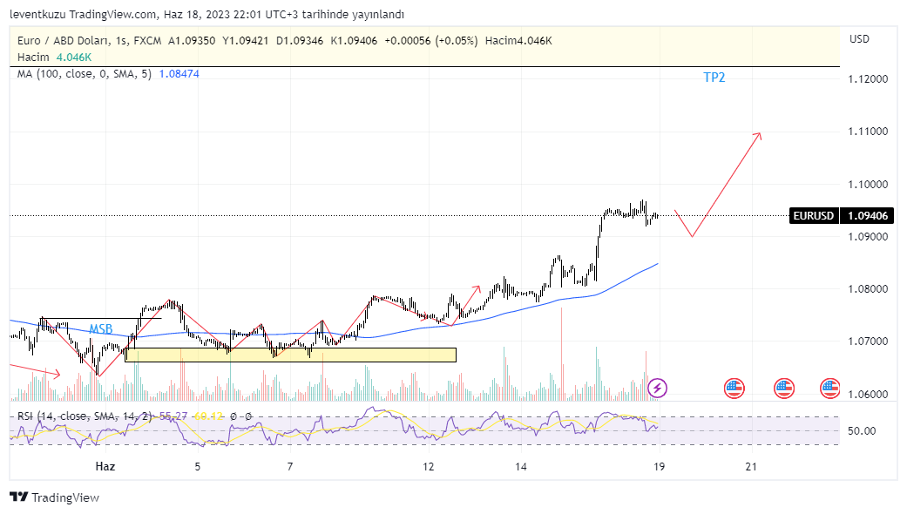
15 min analysis
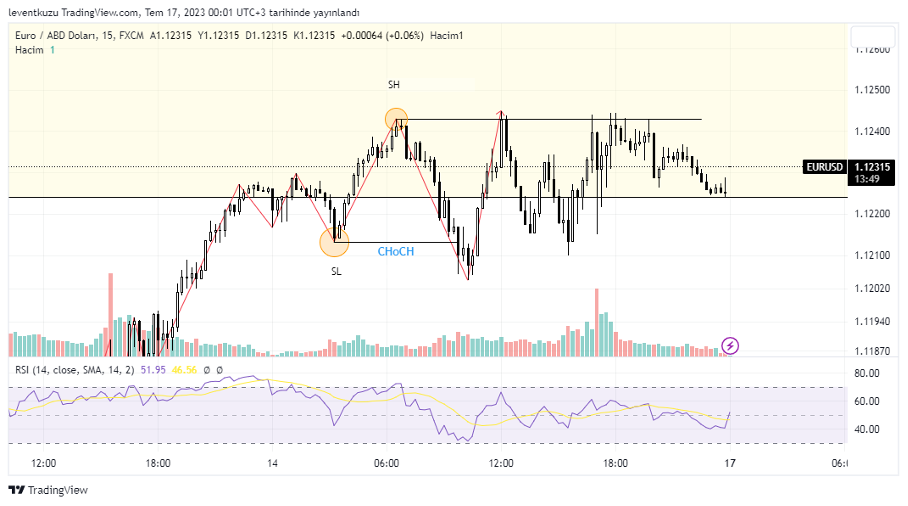
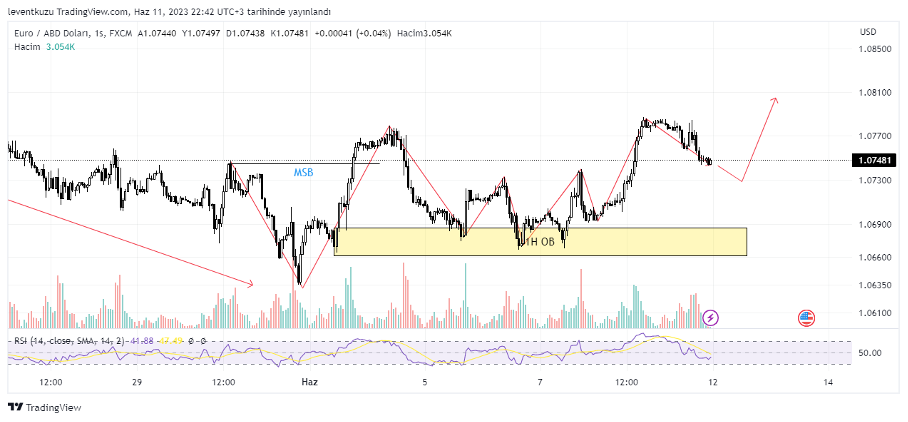
The structure is bearish on 15 min and there is an imperfect shoulder-head-shoulder formation. According to expectation of this formation, we may expect the pair price to reach at least the first liquidity level.
** Important Note: Above ideas are not investment advice!**
Nihat Çetinkaya
https://twitter.com/nhtctnk
I’m a private trader of over 7 years, based in Istanbul.
All trading and research are my opinion, not investment advice.