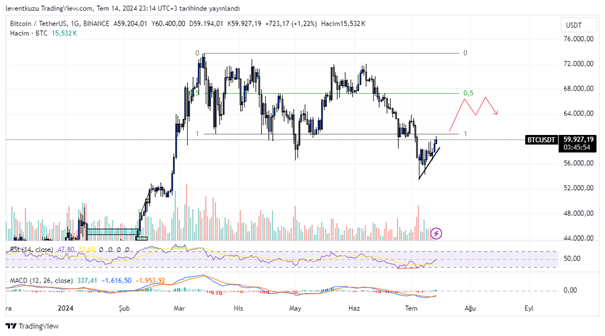
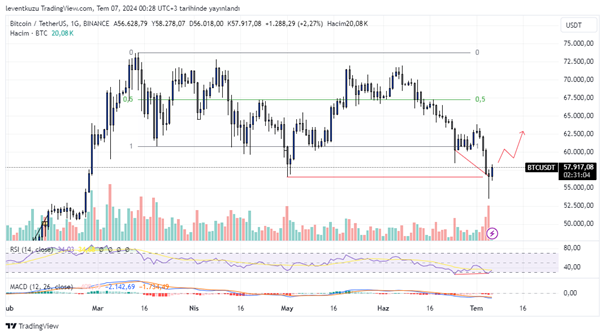
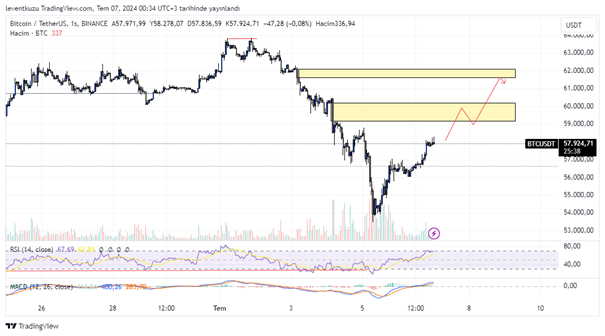
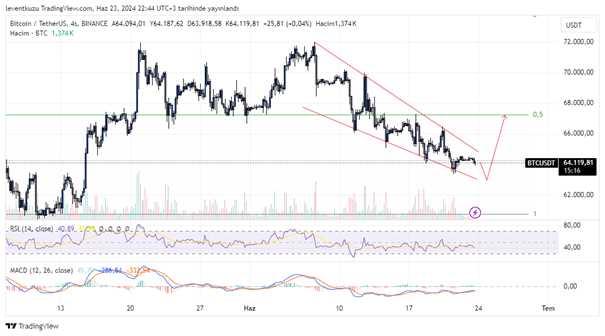
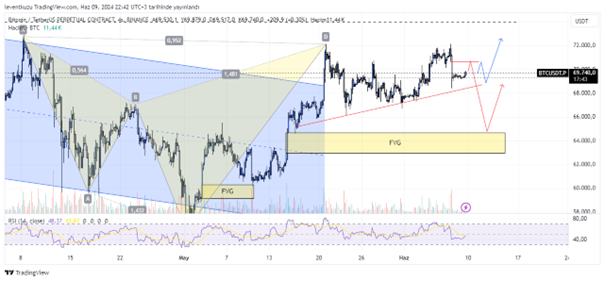
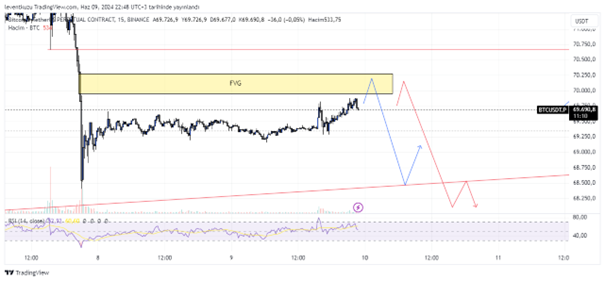
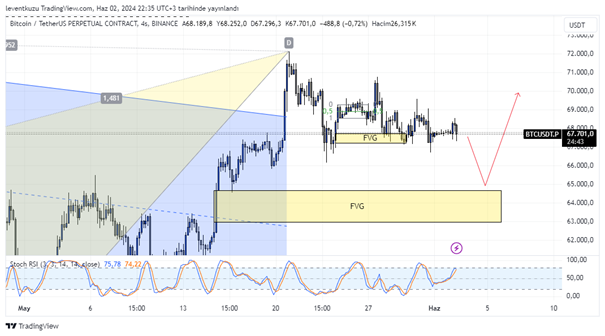
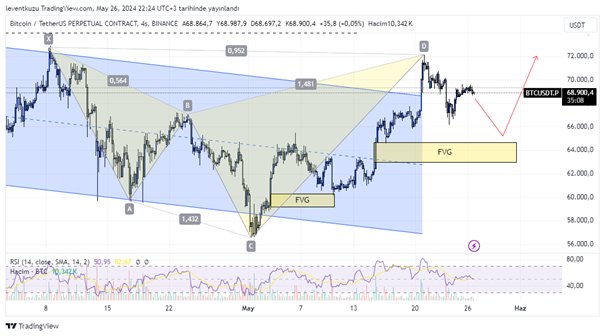
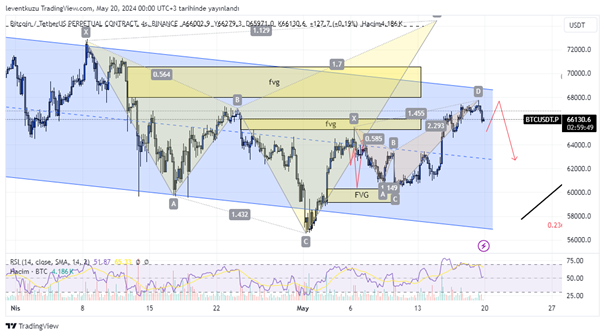
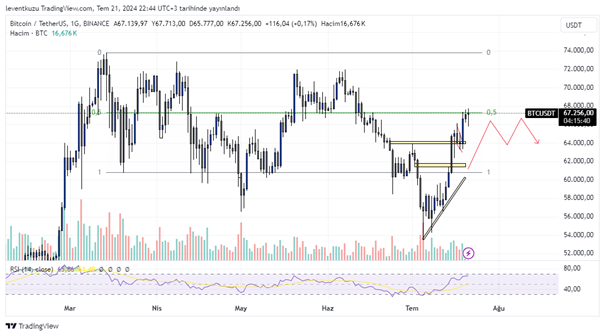
BTCUSDT
1D analysis
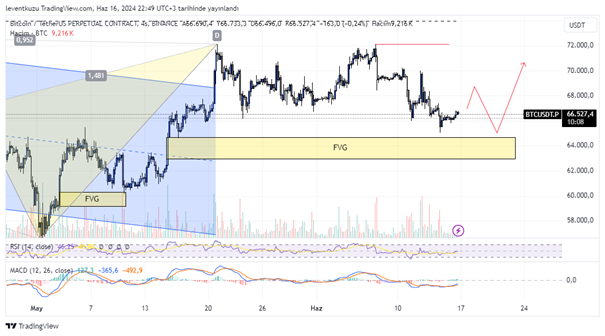
As of now, daily BTC analysis remains successful. The red price path was depicted last week and is still valid. The price was close to range low level and entered the range again. After some increase, it formed a decreasing channel. As of end of the last week, it was broken on bullish side. Equilibrium of the range held the price. There are three wicks but candles were unable to close above the Eq. also considering the current state of overbought RSI, we can experience a price loss to fill some of FVG during the impulsive move. $64k is an important area, where BTC can gain performance to start a movement to test $74k.
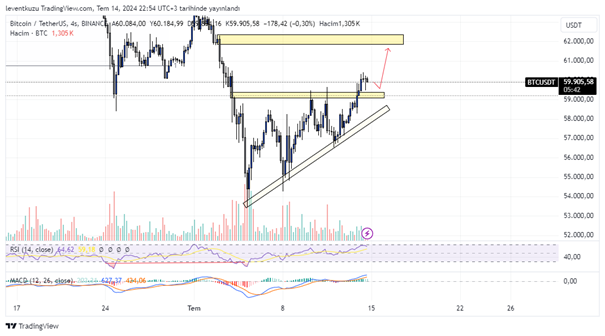
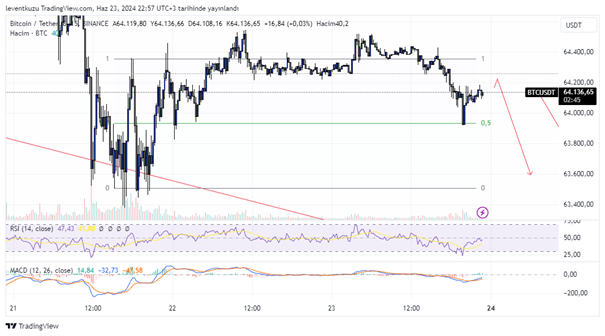
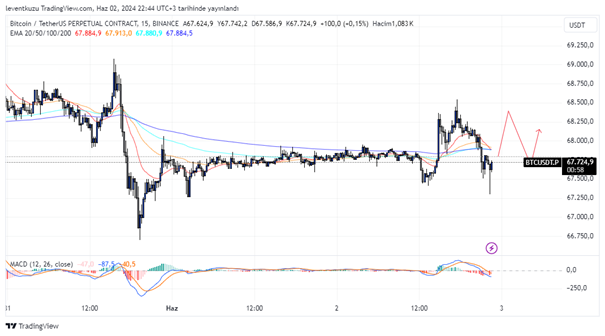
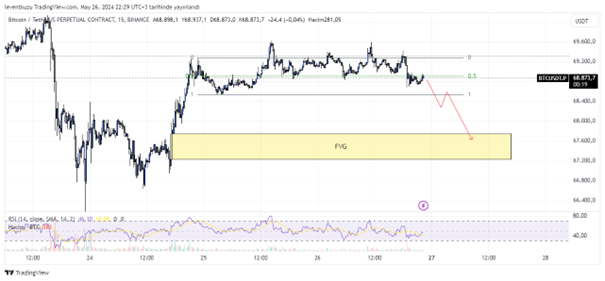
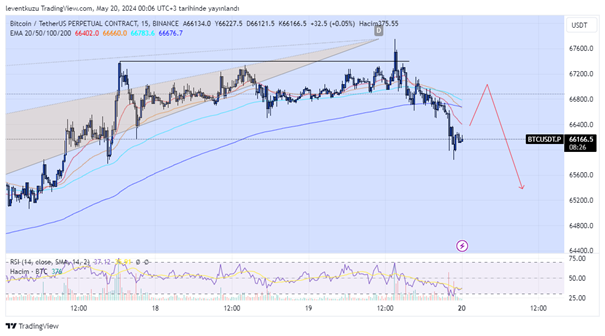
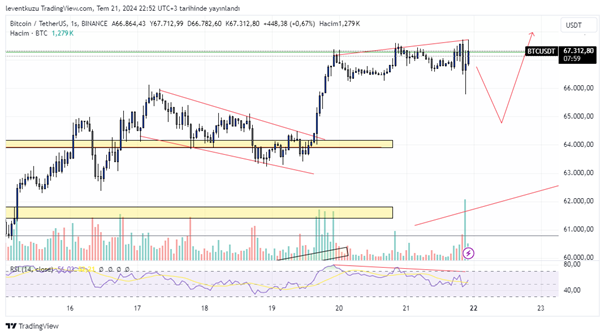
1H analysis
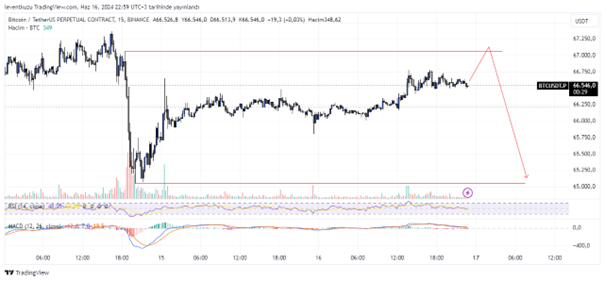
There is a significant bearish RSI divergence on 1H chart. It was artificially being pushed up. Low trade volumes also confirms this during the weekend. Recently, there was a sell off and BTC dropped $1000 in a short time. But buyers was strong and they bought the sold BTC. According to bearish signs, $64-65k can be a fuel to push BTC higher price levels.
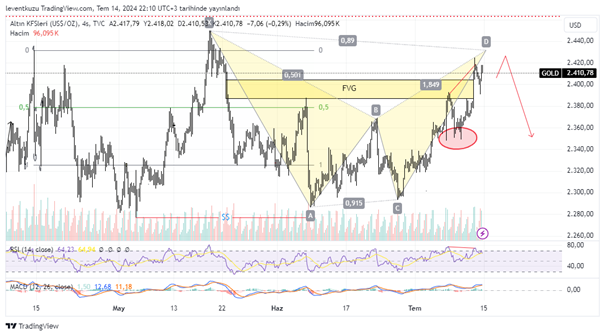
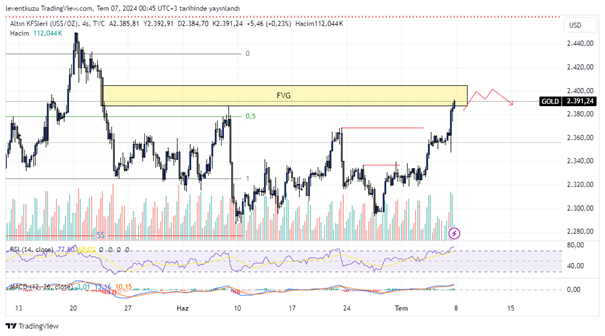
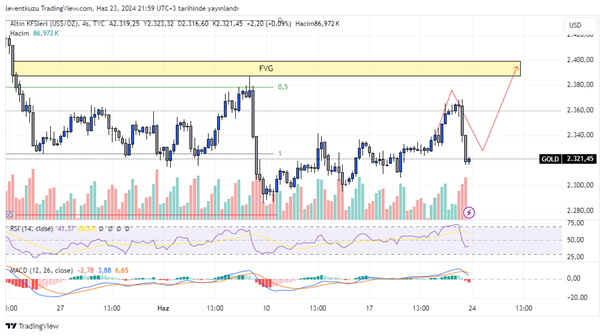
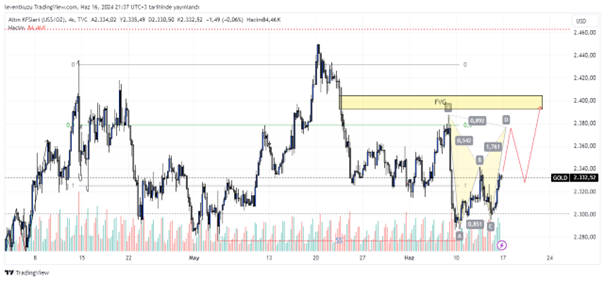
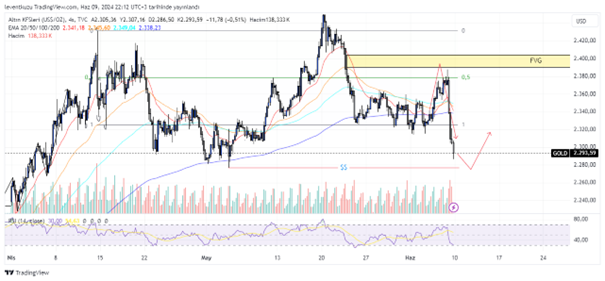
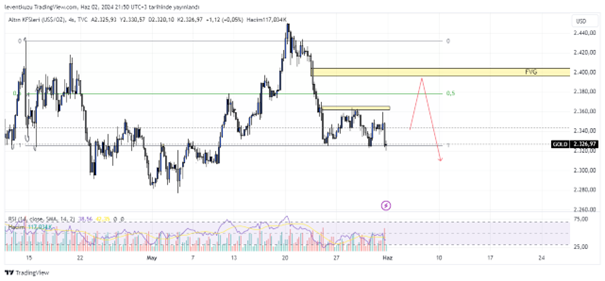
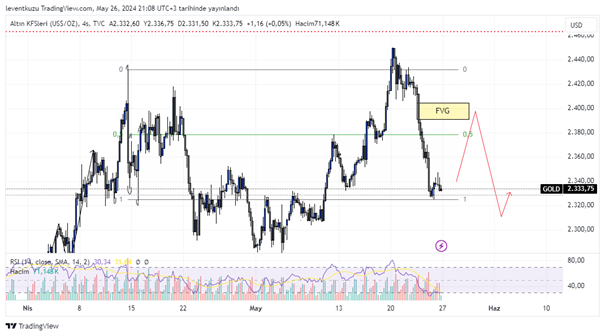
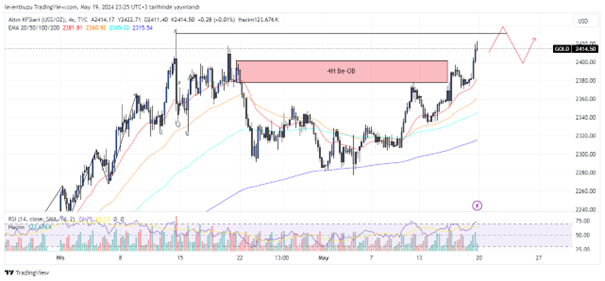
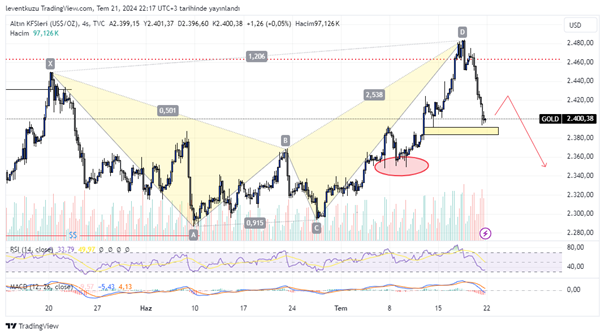
XAUUSD
4H analysis
According to the analysis of last week, the expectation was a bearish bat formation. Price continued to its upward movement and formed an alternate bat formation. X-D was reversed from 1.2, which ideally had to be 1.13. On the other hand, the dashed red line represents the target for AB=CD on weekly chart. All high time frame targets seem to be fulfilled. The correction has started. The price is close to a 4H FVG. Previously mentioned below liquidities are also remains as a target zone.
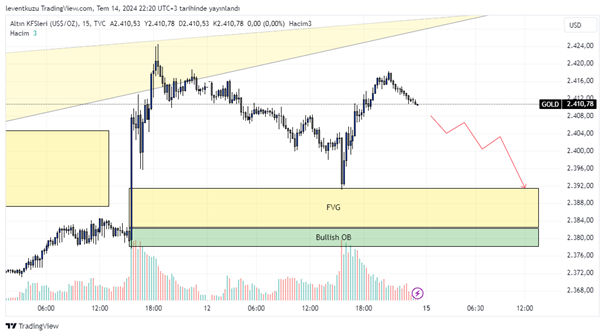
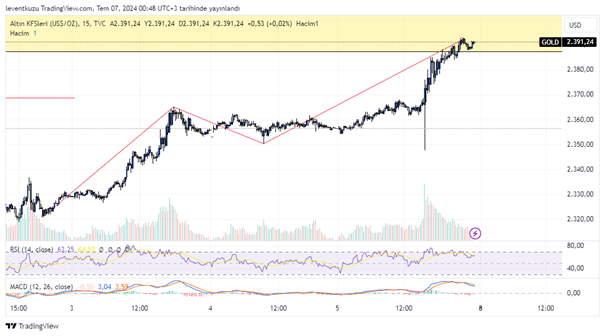
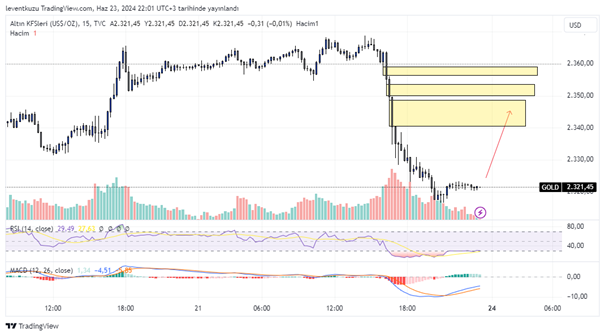
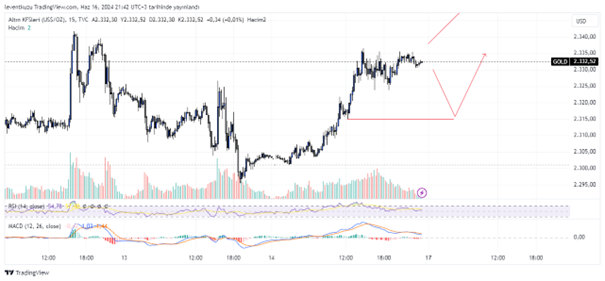
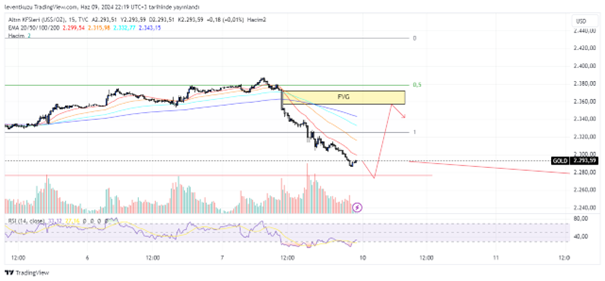
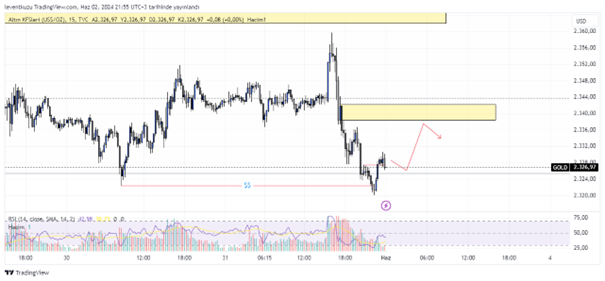
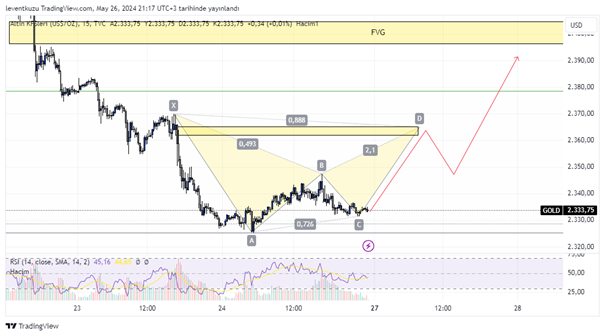
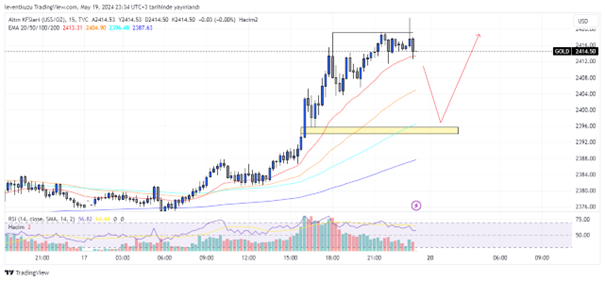
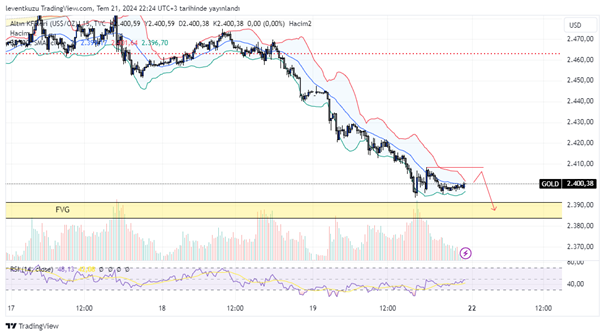
There is a steady decrease in the price. 15 min RSI is gaining some strength and Bollinger bands tighten. First the median value inside the bands should be exceeded. After that we may expect a sharp movement from the narrow channel. The most likely will be the interest zone below.
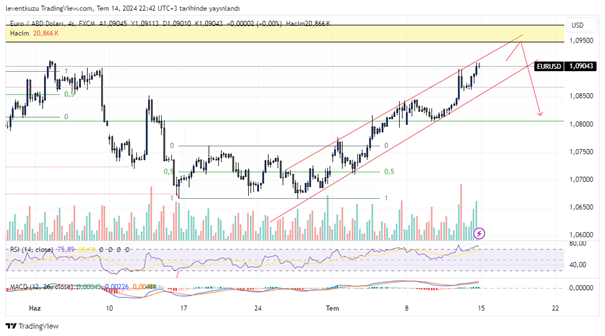
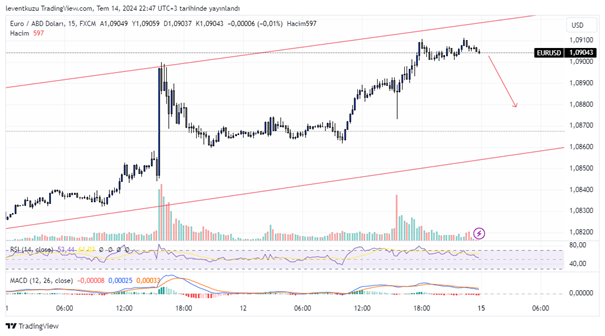
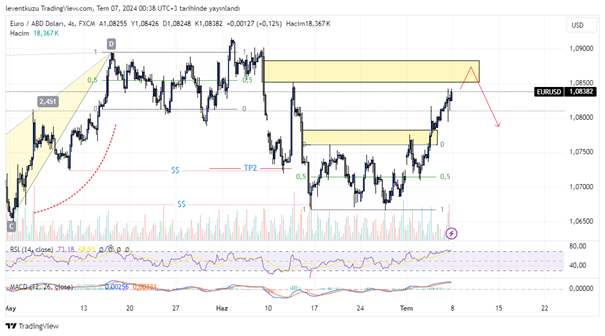
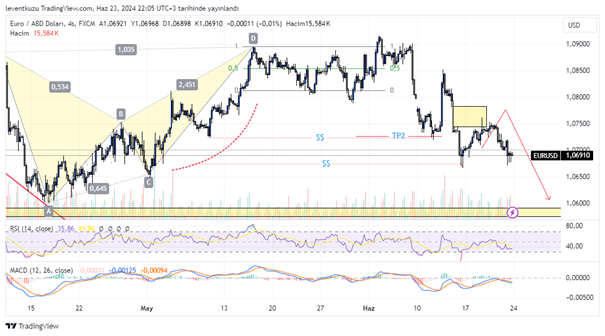
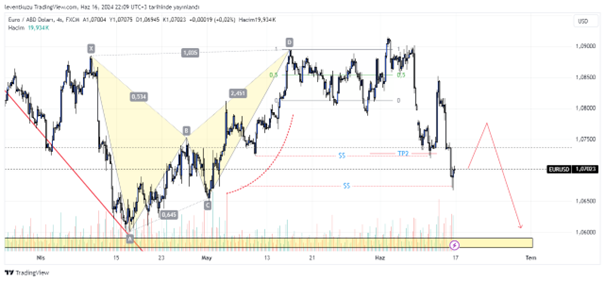
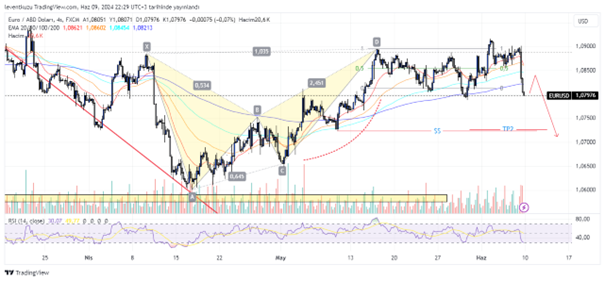
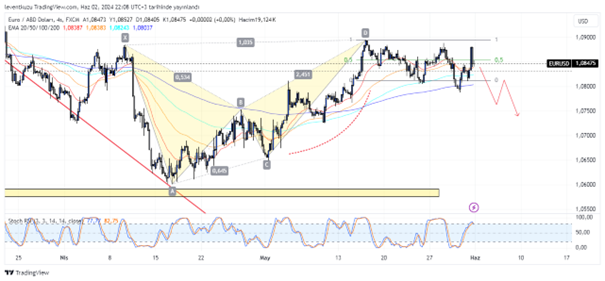
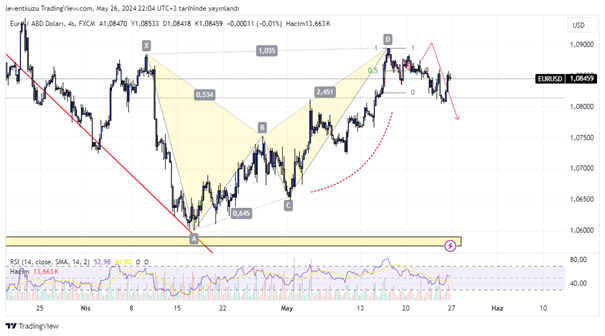
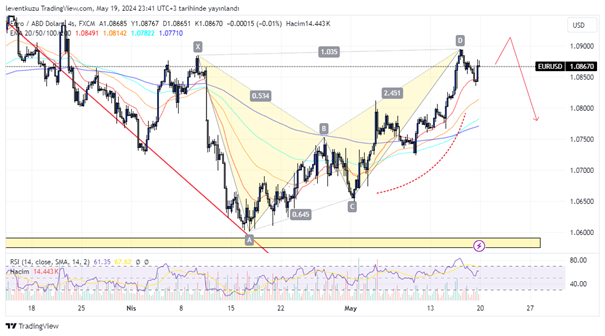
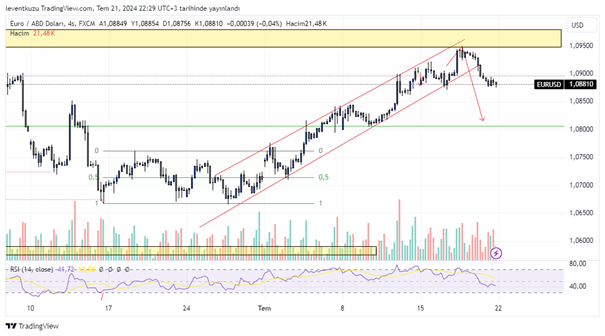
EURUSD
4H analysis
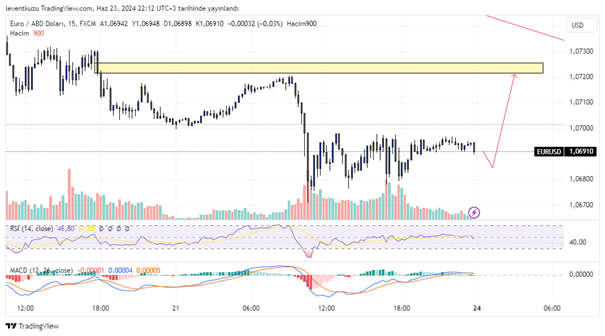
Pair price of EURUSD did exactly the same movement that we drew last week. The price was increasing through a channel and it was reversed from the daily resistance zone. Now, there are significant zones that can attract the pair price. Around 1.085 a FVG is available. As this is a 4H chart, this point of interest will be the closest target.
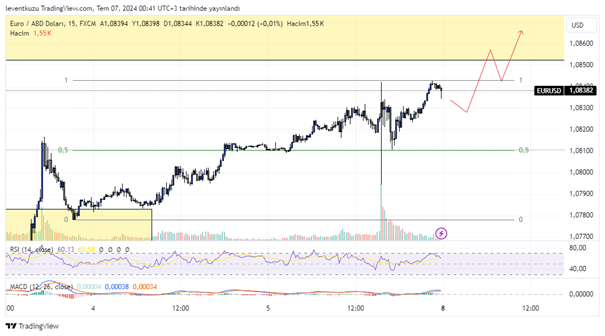
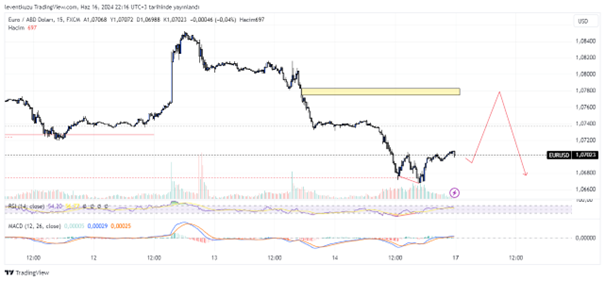
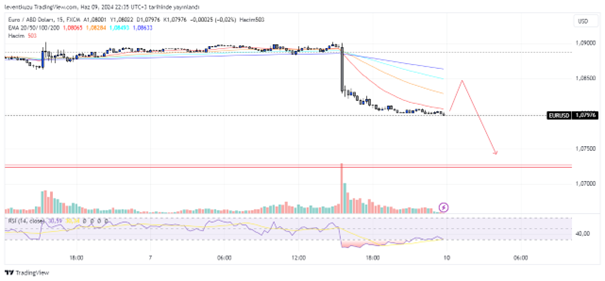
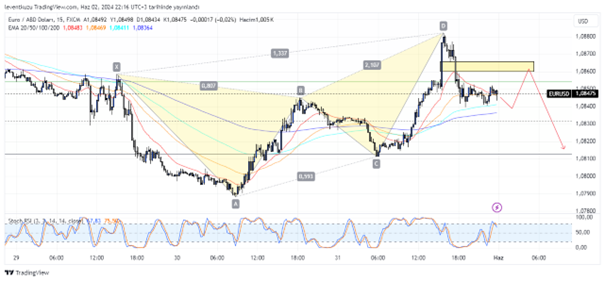
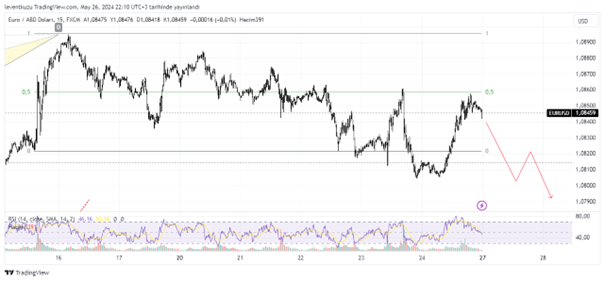
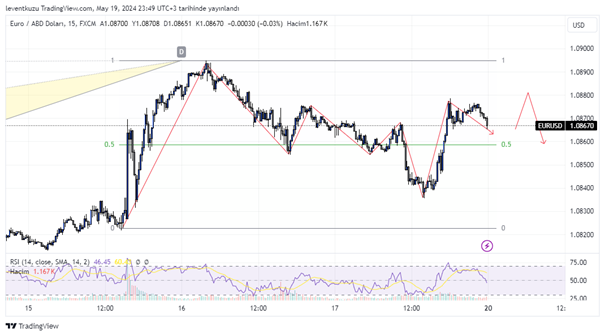
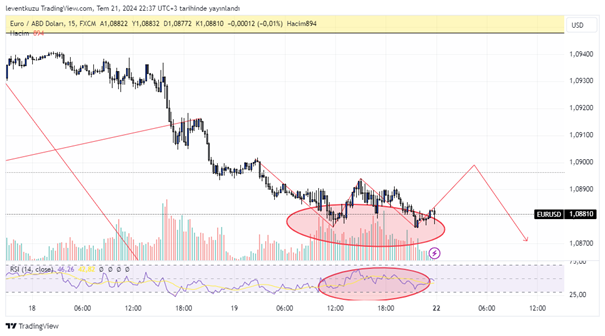
15 min analysis
There is an increasing signal on the 15-minute chart. A bullish RSI divergence is present. Price will probably increase to the black dashed line close to 1.09. after that downward price movement continuation can occur, which is available on the HTF chart.
** Important Note: Above ideas are not investment advice!**