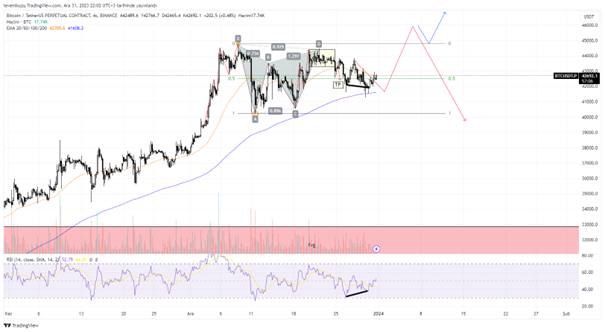
BTCUSDT
4H analysis
The price has undergone a correction after the last bullish move. A range was formed through the correction movement. A harmonic pattern was formed within the last swing high and swing low points, which are shown by orange circles. previously mentioned harmonic pattern reached its target price. Now, we can observe a bullish RSI divergence. This may cause the price to go higher levels. We may expect the price to go beyond the higher level of the range. If it happens, two different paths will be possible. IF RH holds the price, it means BTC will go higher prices. If not, RL will be broken and we may expect further lower prices.
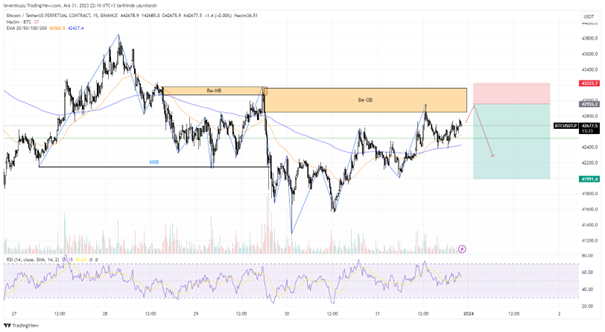
15min analysis
After following a bullish path, price made mitigation. then price continued its bearish movement and swept liquidity form swing low. After that, mitigation block held the price and a strong bearish movement occurred. The market structure was shifted. The fresh order block was reached once but there is possibility to be reached once more. As the bearish movement was made by relatively more impulsive candles with higher volume, it is worth trying for a short position.
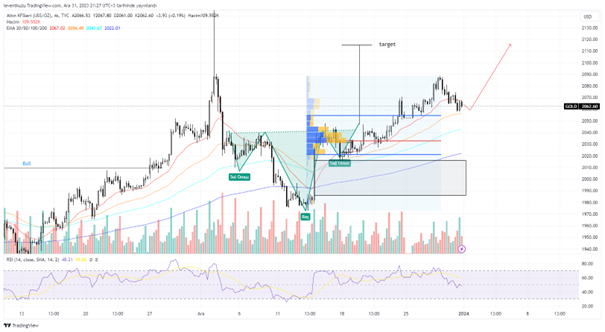
XAUUSD
4H analysis
an inverse shoulder-head-shoulder formation was identified last week and the price is still increasing according to that formation. A little correction was observe, however, it did not make a market structure shift in the current time frame. EMA50 held the price. This point also corresponds to value high of the equally distributed volume profile. the target is still $2,100s.
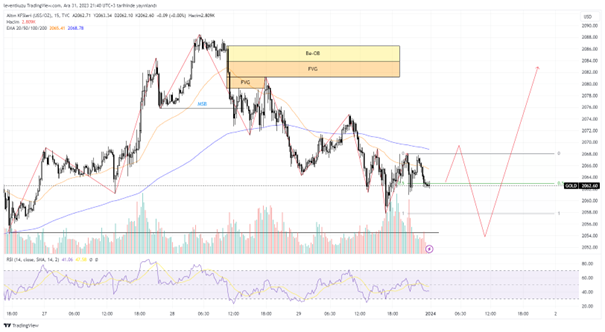
15 min analysis
Market structure shifted to bearish on 15 min chart. The bearish order block was instantaneously followed by fair value gap. Some part of the fair value gap was filled. However, the price still makes lower lows and lower highs. In the current structure, a liquidity removal may drive the price to upper levels. $2054 is a possible liquidity price. The price can increase from this level.
EURUSD
4H analysis
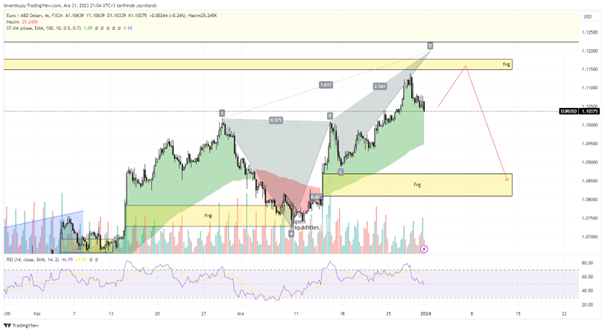
The generated bearish butterfly was invalidated last week. A new harmonic formation is now possible due to the point of interest that is available from long ago. Bearish deep crap can be formed if the price wants to fill the fair value gap. the retracement of that pattern will probably bring the fair value gap below. therefore, the first target will be 1.115-1.118 and then we may expect 1.09-1.08 pair price.
15 min analysis
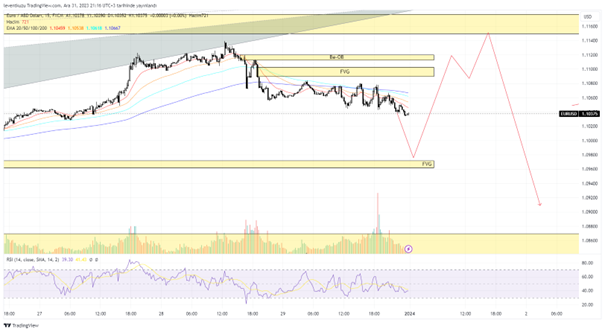
By the huge bearish candles, market structure shifted from bullish on 15 min time frame. the order block worked well and did not let the price go above. There are significant fair value gaps on the chart. The upper most and lower most FVGs were previously shown on 4H chart. There are two more fair value gaps from 15 min chart. The most likely path for the price is shown by the red colour.
** Important Note: Above ideas are not investment advice!**