BTCUSDT
4H analysis
The range drawn last week is still valid. After range high was broken upwards, price was unable to hold. It lost momentum significantly. If this was not the case, the probable movement would be a correction down to FVG and move upwards. However, price moved down to equilibrium. Now, there is a violation. If it cannot hold anymore, the target will be range low or inner liquidities.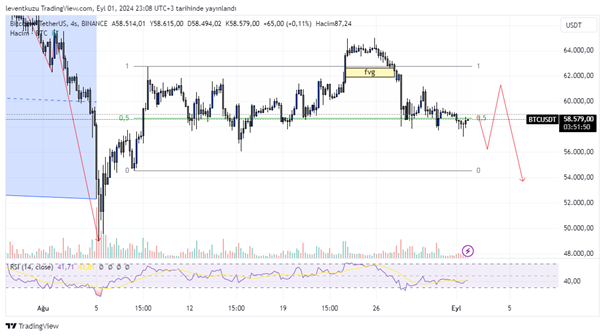
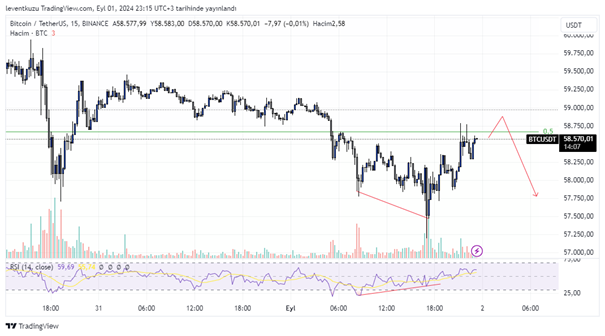
15 min analysis
A bullish RSI divergence is present on 15 minute chart. This shows a possible increase of the price. However, it tested equilibrium twice but unable to break the zone. A decrease can happen after a tiny upward movement.
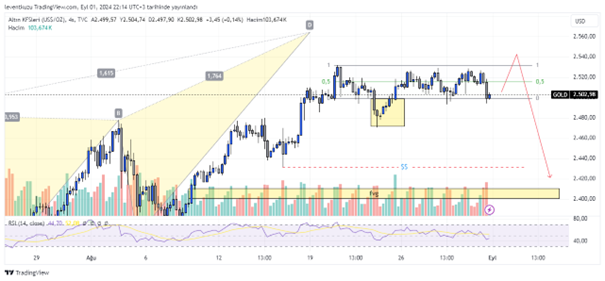
XAUUSD
4H analysis
There is not much change since last week. After the formation of the harmonic pattern, we were looking forward for a price drop. However, price kept its level. We could only observe a deviation of the range, which swept imbalance. The price is currently within the range. Above liquidities are unmitigated. We can observe an increase and then a movement towards the liquidity and then the fair value gap below. As the price is accumulating within the range, the RSI drop is obvious. This can be a sign for the break direction of the price.
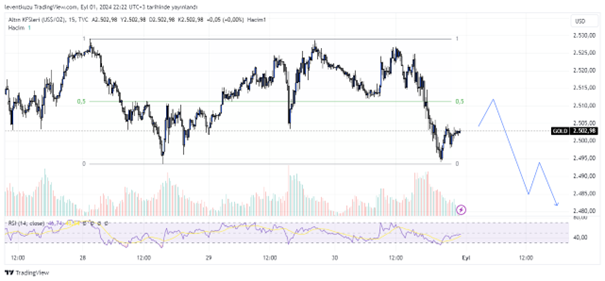
15 min analysis
A range also exist in 15 minute chart. The last impulsive movement formed the range but it has not been broken to either sides. Equilibrium reactions of the range are significant, which confirms the validity of it. An increase up to either equilibrium or range-high is possible. After reaching these points, price will break range-low to make lower lows.
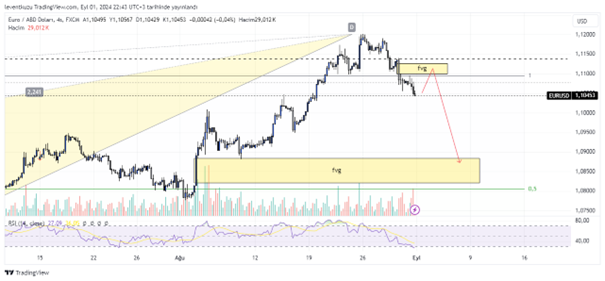
EURUSD
4H analysis
The analysis of the last week is valid. We expected a drop without an increase because the price was in the entry position of the harmonic pattern. We could recently observe a market structure break by a candle close below 1.11. The break movement was with a candle including FVG. RSI is in the over-sold region. We can now await for an increase until above FVG, then price will keep its movement down to 1.085 pair price.
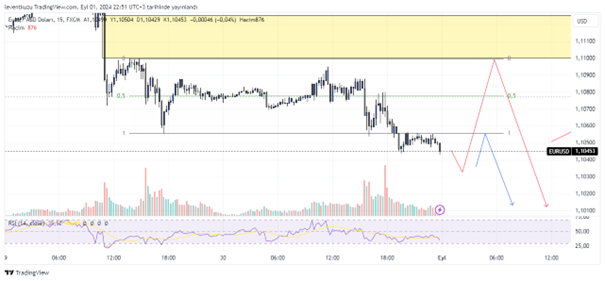
15 min analysis
A range is drawn for 15 minute chart. The price tested equilibrium from below and over the line several times. At the end, the range was broken from the range-low. It retested the range-low. There are two possibilities. First, it can move to lower prices because retest was successfully completed. Second, a deviation can occur and a deviation until range high can happen and sweep some of FVG, then move down to HTF analysis target.
** Important Note: Above ideas are not investment advice!**